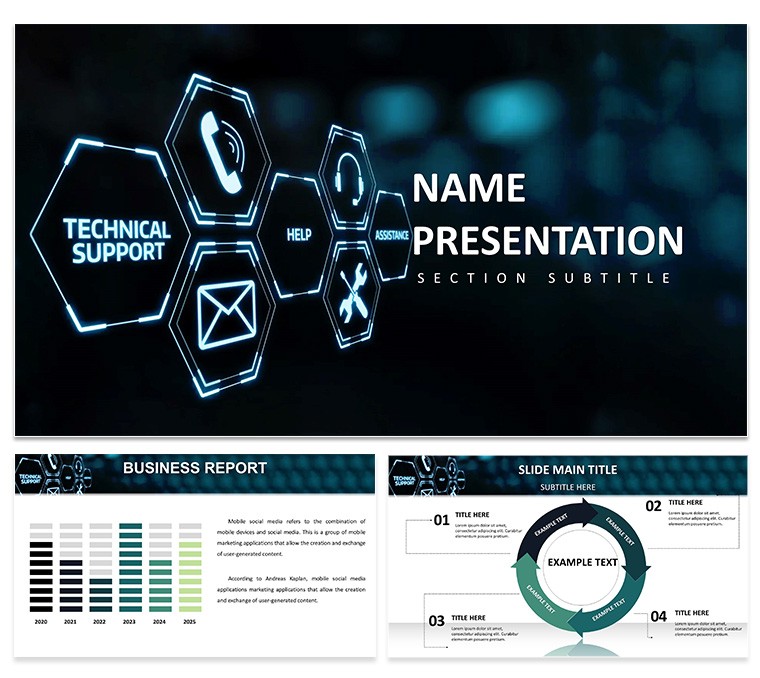
In the high-stakes world of IT support, where downtime costs businesses thousands per minute, effective communication is key to swift resolutions. This Technical Support PowerPoint template is engineered for helpdesk professionals, IT managers, and trainers, providing 28 specialized diagrams to demystify troubleshooting processes and service metrics. Envision transforming a chaotic ticket backlog into a streamlined narrative that guides teams through root cause analyses and preventive strategies. Designed with a fresh, tech-savvy aesthetic, it tackles common hurdles like jargon overload, offering visuals that foster understanding and collaboration across non-technical stakeholders.
Standout Features for Support Excellence
Anchored by three master slides and three backgrounds, the template features sharp color choices and future-looking imagery that evoke reliability. Seven color schemes enable customization - subtle greens for calm resolution flows or alerts in red for urgent escalations. The 28 diagrams encompass process maps for incident management, timelines for SLA tracking, and charts for performance KPIs like first-call resolution rates. Compatible with PowerPoint and Google Slides, it supports easy edits, with vector icons of tools and networks ensuring scalability. Animations, such as step-by-step reveals in diagnostic trees, enhance training sessions without overwhelming viewers.
In-Depth Look at Diagram Capabilities
Core components include flowchart slides for mapping helpdesk workflows, from ticket intake to closure. Bar graphs visualize response times, benchmarked against ITIL standards, while pie charts break down issue categories like hardware vs. software faults. For global teams, maps highlight support center locations, and matrix diagrams compare tools like Zendesk versus ServiceNow. Each is fully editable, allowing integration of real metrics from monitoring software like Nagios.
Everyday Applications and Proven Benefits
For IT advisors pitching services, use intro slides to outline value propositions, followed by case studies like how a Fortune 500 firm reduced outages by 35% via visualized protocols. Trainers can employ sequence diagrams for onboarding, aligning with CompTIA certifications to build expertise. In daily operations, helpdesk groups present quarterly reviews with heat maps of high-incident areas, drawing from Gartner reports on support trends for authoritativeness.
Surpassing basic templates that lack specificity, this one's tech-inspired symbols - keyboards, servers - add context, improving comprehension and potentially cutting training time by 20%, per industry benchmarks from HDI. Ideal for cybersecurity briefings intertwined with support, where Venn diagrams overlap threat responses with routine maintenance.
Guide to Tailoring Your Support Deck
- Set the Scheme: Pick colors reflecting your brand's reliability, like blues for trust in customer interactions.
- Load Data: Insert KPIs from tools like Freshdesk, creating dynamic visuals.
- Incorporate Links: Embed to knowledge bases for interactive elements.
- Apply Dynamics: Animate paths in troubleshooting guides for engaging demos.
- Validate Output: Preview for accessibility, ensuring inclusivity in diverse teams.
This mirrors IT best practices, emphasizing efficiency akin to ISO 20000 standards.
Fostering Trust in Technical Communications
To uphold , weave in citations from reliable sources like Forrester's IT service management insights, using dashboards for metric displays. Support pros report heightened team morale from clearer visuals, enabling focus on solutions over explanations. Versatile for startups scaling support or enterprises optimizing ticketing, the design promotes a proactive culture.
Adapt further: convert to e-learning modules or share via cloud for remote support scenarios.
Boost Your Support Game Today
Equip your team with this essential template - download now to turn technical challenges into triumphs.
Frequently Asked Questions
How flexible are the process diagrams?
Completely editable to match your unique IT workflows and metrics.
Is it ideal for remote training?
Yes, Google Slides compatibility supports virtual collaboration.
What sets it apart from generic IT templates?
Specific support icons and schemes tailored for helpdesk scenarios.
Can I add custom data sources?
Easily integrate from CRM systems for personalized insights.
Are animations suitable for professional settings?
Subtle and purposeful, enhancing without distracting.