 Click to zoom
Financial Market Analysis PowerPoint Template - Data-Driven Charts | Instant Download | ImagineLayout
| Format | .pptx |
| Slides | 3 unique layouts |
| Aspect ratio | 16:9 |
| Compatibility | PowerPoint |
| Animated | 否 |
| Language | English |
| License | Commercial |
| File size | — |
| Version | v1.0 |
| Last updated | March 2026 |
What's inside
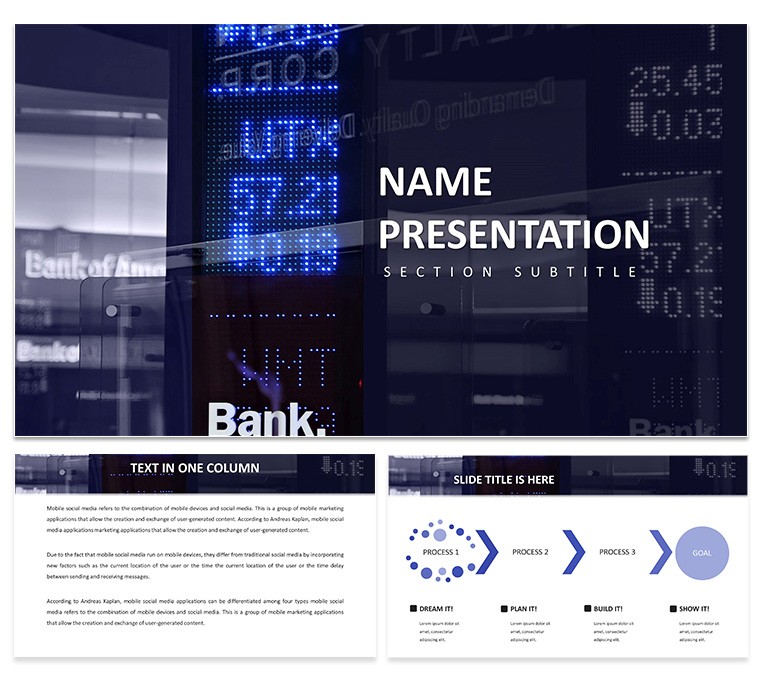
Download the Financial Market Analysis PowerPoint Template with 28 editable diagrams in 7 color schemes. Ideal for analysts to present market trends, stock data, and insights to executives and clients. Instant PPTX download.
What's Included
The Financial Market Analysis PowerPoint Template supplies 28 diagrams focused on market trends, performance metrics, and data visualization. The package includes 7 color schemes, PPTX and POTX files, and JPG previews. It differentiates from the general financial statements templates in the related section by concentrating on dynamic market analysis rather than static reporting.
Chart and Diagram Range
Visuals include trend lines, comparison matrices, and volatility indicators. The layout style uses professional grid alignment to keep dense financial data readable.
Key Features
All 28 diagrams are fully editable so you can input live data or update figures instantly. The seven color schemes support both conservative finance palettes and vibrant presentation styles. This template provides deeper market-specific visuals than the related Excel growth analysis templates.
FeatureDetailsDiagram Count28Color Schemes7File FormatsPPTX, POTX, JPGEditable ElementsText placeholders, color fills, icon layersCompatibilityPowerPoint 2016+LicenseCommercial use includedProfessional Use Cases
Client Portfolio Review
An investment advisor at a private wealth firm used the Financial Market Analysis PowerPoint Template to present quarterly market trends to high-net-worth clients. The comparison diagrams clarified volatility patterns, helping three clients rebalance portfolios and avoid potential losses.
Executive Strategy Meeting
A financial analyst at a regional bank employed the template`s trend diagrams during a C-suite meeting on economic indicators. The clear visuals supported data-backed recommendations that were adopted into the bank`s 12-month investment policy.
Present market insights with confidence. Download today.
How to Customize
After downloading, open the PPTX file. Select the relevant diagram and replace placeholder numbers or labels with your latest market data. Apply one of the 7 color schemes via the Design tab. Link Excel charts if needed for live updates. The entire process averages 12 minutes per deck and produces a file ready for boardroom projection or PDF distribution.
Why Choose This Template
Manually creating market analysis charts can require multiple hours and still look inconsistent. This template offers 28 ready diagrams in 7 color schemes that are already formatted for financial data. The design decisions prioritize readability of numbers and trends, critical in high-stakes presentations. The related financial statement templates on the site focus on static reports while this one emphasizes dynamic market insights.
FAQ
Can I link live Excel data to the diagrams?Yes, the diagrams accept standard Excel linking. Paste your data table and refresh links to keep charts current. This feature is commonly used by analysts who update presentations weekly with fresh market numbers.
Are the colors suitable for formal financial reports?The seven color schemes include conservative palettes with navy, gray, and green tones commonly used in banking and investment materials. You can also create custom palettes to match your firm`s brand guidelines.
What licensing covers client deliverables?The commercial license allows you to use the diagrams in client reports, investor decks, and internal strategy documents. Finished presentations may be distributed to paying clients.
Does the template support dark mode presentations?Yes, several of the 7 color schemes are optimized for dark backgrounds. Simply switch the theme variant and all diagrams adapt automatically while keeping text legible.
How long does it take to prepare a full analysis deck?Users typically complete a 20-slide deck in 25-40 minutes by selecting appropriate diagrams from the 28 available, entering data, and choosing a color scheme. The structured layout reduces formatting time dramatically compared with starting from blank slides.
Good for
- Project roadmaps and sprint plans
- Product launch timelines
- Quarterly or annual review decks
- Company history and milestone summaries
Licence
reviews
The process maps with step-by-step workflows helped me document a supply chain audit and my team actually understood the filing protocols.
Used the timeline slides for a project roadmap presentation and the drag-and-drop deadlines feature worked as promised.
Good for recurring reports but some of the diagrams felt repetitive across the 28 slides.
The .potx format gave me full control but my coworker couldn't open it in an older PowerPoint version so that was annoying.
Decent for corporate reports but the background textures with paper stacks and clocks were a bit distracting for data-heavy slides.
FAQ
Will it work in Google Slides?
Are fonts embedded?
Can I use this for client work?
What's the refund policy?
Do you update the template after purchase?
Similar templates
See all PowerPoint Templates →


All 1 slides