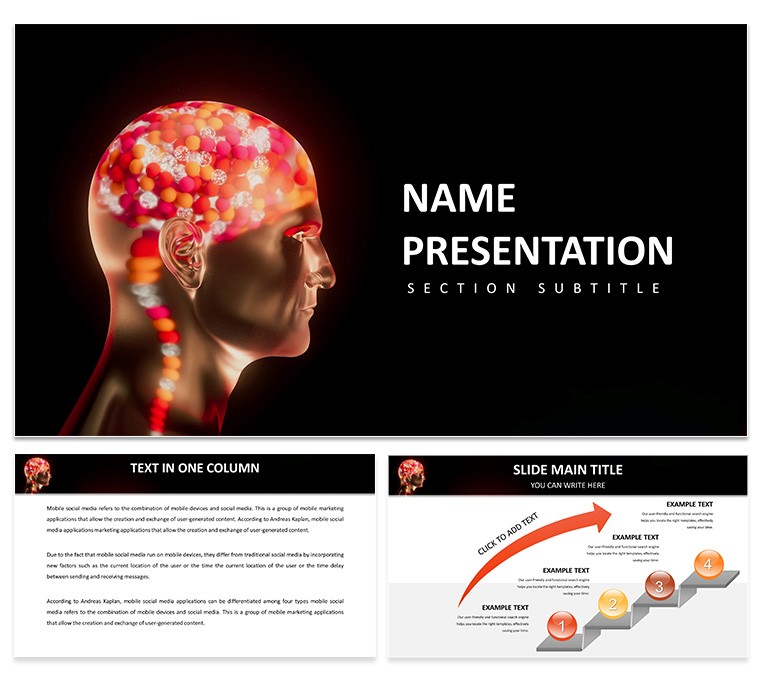
Imagine keynote-ing at a neurotech summit, where your slides don't just describe synaptic sparks - they simulate them, with neural pathways lighting up to mirror memory formation or axon signals firing in rhythmic waves. The Brain Potential PowerPoint Template, available for $22, arms researchers, lecturers, and innovators with 28 brain-mapped diagrams in seven evocative schemes, making abstract cognition concrete and conferences unforgettable.
From PowerPoint 2016+ to Google Slides harmony, this deck adapts to your research rhythm. Customize for grant proposals detailing fMRI findings or classroom deep-dives into neuroplasticity, effortlessly layering in EEG waveforms or 3D lobe models. It's more than visuals; it's a neural net for ideas, ensuring your breakthroughs bridge the gap from lab to layperson.
Drawing from synaptic elegance, the template employs lobe silhouettes for section dividers and dendrite branches for idea trees, transforming data dumps into discovery journeys. A grad student might chart evolutionary brain scaling with growth curves, while a clinician visualizes therapy outcomes via before-after matrices. The payoff? Audiences not only follow but foresee implications, fueling collaborative sparks.
Neural Network of Features: What Powers This Deck
Three master slides form the cortex: A layered anatomy view for holistic overviews, a waveform grid for signal analyses, and a modular cluster for hypothesis breakdowns. The 28 diagrams encompass stars - spider maps for cognitive domains, helix timelines for developmental milestones, and contour plots simulating brainwave terrains.
High-fidelity vectors of 50+ neural icons - from neurons to glial cells - bend to your palette across seven schemes, evoking twilight purples for introspection or electric blues for activation studies. Animations cascade like action potentials, unveiling layers progressively, while embedded formulas auto-compute correlations from imported stats. This infrastructure anticipates analytical angles, from plotting dopamine pathways to diagramming AI-brain interfaces.
Lab to Lecture: Applications That Activate
Envision a professor prepping a seminar on memory encoding. Initiate with a hemisphere slide, annotating lobes with session foci amid firing synapses. Advance to methods: Harness a parallel process chart to parallel experimental protocols, animating phases from stimulus to recall metrics. For results, deploy a violin plot overlaying variability in recall accuracies, hues differentiating age cohorts.
Synthesize in a concept wheel, spokes radiating key takeaways like "Plasticity Persists." This architecture scaffolds comprehension, turning passive listeners into probing participants via embedded discussion prompts.
For outreach, repurpose neural flow slides into infographics for journals, or interactive variants for VR demos linking to simulation apps. These extensions extend impact, from peer reviews to public podcasts, amplifying your voice in the neuro chorus.
Refinement Routines for Research-Ready Slides
- Synaptic Styling: Align icon clusters to mirror actual connectivity for authenticity.
- Data Dynamics: Embed R scripts for on-slide regressions during live analyses.
- Projection Prep: Calibrate contrasts for projector fidelity in dim venues.
- Ethical Edits: Anonymize subject icons in clinical visuals for compliance.
These practices polish presentations to professorial prowess, ensuring every neuron counts.
Surpassing Stock Slides: Cognitive Edge
Default decks dilute details with bland boxes, obscuring nuances like hemispheric asymmetries. This template's specialized schematics and auto-norms preserve precision, redirecting focus to findings over formatting. Versus piecemeal neuro images, its cohesive corpus fosters flow, commanding respect in rigorous realms. For $22, it accelerates academic output, suiting solo scholars or symposium squads.
Acquire the Brain Potential PowerPoint Template for $22 and synapse your science with stunning storytelling.
Frequently Asked Questions
Are neural diagrams anatomically accurate?
Yes, based on standard models, with flexibility for specialized annotations.
Supports data visualization tools?
Integrates with Excel and basic Python outputs for seamless stats.
Google Slides friendly?
Completely, for fluid remote collaborations on research drafts.
Number of brain-specific layouts?
25+, covering functions from sensory to executive.
Custom animation options?
Extensive, from pulse effects to phased reveals mimicking neural firing.
Usage rights for publications?
Full, with editable elements for journal-ready exports.