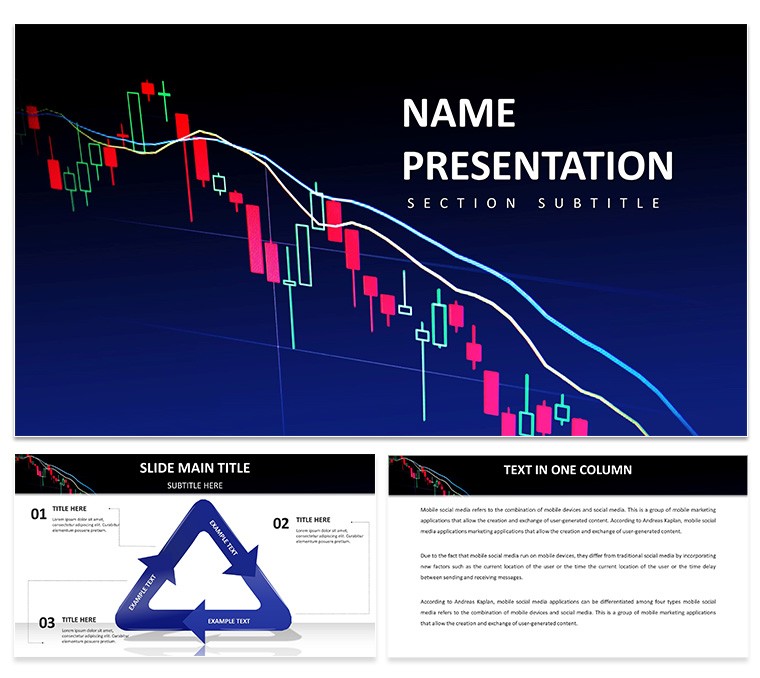
Use this polished and visually appealing Market Trends PowerPoint Presentation Template to keep one step ahead of the competition. With its modern structure, sharp images, and adjustable slides, this template is designed to help you show complicated market data in an understandable manner. It is ideal for market analysis, trend forecasts, and business presentations, since it has sections for graphs, charts, and critical statistics that highlight important information and ideas. This template helps guarantee that your ideas are presented clearly and professionally, whether to clients, investors, or team members. Enhance your presentation with a simple style and eye-catching components to make it simpler to track and evaluate market trends.
What is a PowerPoint presentation template for market trends?
A Market Trends PowerPoint Presentation Template is a ready-made presentation that highlights consumer trends, market insights, and industry advances. It includes graphics, graphs, and charts illustrating market risks, growth potential, and developments. Because the template is changeable, customers may add their own data and customize the fonts, colors, and pictures to reflect their identity.
Use Cases for Template
This template is used in a variety of corporate situations, including:
- Quarterly reports: Provide a visual overview of competition, new markets, and revenue growth.
- Inform investors: On market developments and trends that affect company expansion.
- Product Launch Strategy: Demonstrate a product's potential for success and how it fits into market trends.
- Compare rivals' data: To market trends.
- Marketing Strategy: Demonstrate dynamic patterns of client participation and preferences.
Who needs this template?
This template may be used by professionals from a wide range of fields, including:
- Marketing and sales teams: Responsible for maximizing approaches based on market trends.
- Startups and entrepreneurs: Show investors the prospects and capacity for growth.
- Analysts and consultants: Show clients data analysis.
- Executives and strategists: Should utilize clear, visual data to guide their decisions.
- Financial advisers: Should outline the opportunities and risks connected with investing.
Why Choose This Template?
This template converts complex data into visually appealing charts and graphs, making it easy to understand. It allows you to boldly and effectively communicate your ideas while saving time, optimizing the design process, and ensuring that your presentation looks polished and professional.