 Click to zoom
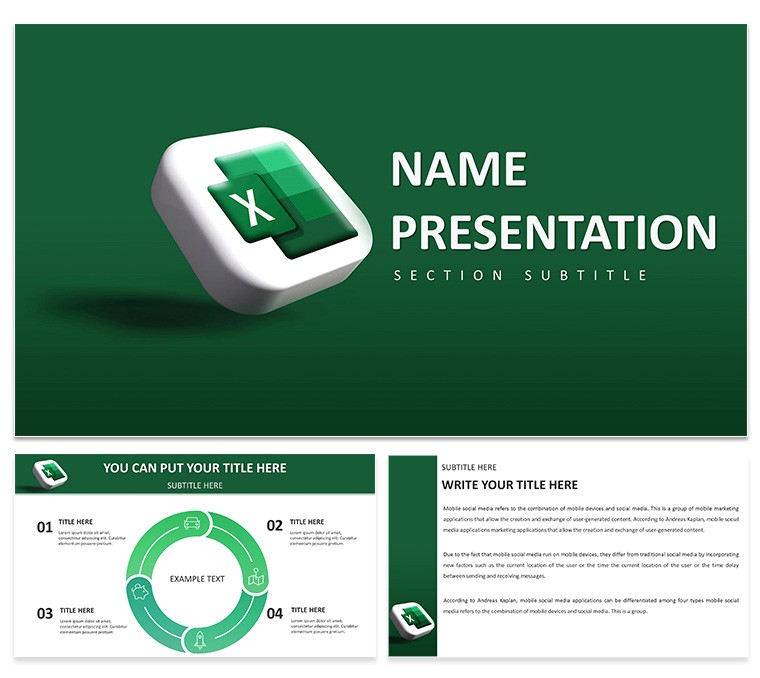
Excel Financial Growth Analysis PowerPoint Template
| Format | .pptx |
| Slides | 3 unique layouts |
| Aspect ratio | 16:9 |
| Compatibility | PowerPoint |
| Animated | No |
| Language | English |
| License | Commercial |
| File size | — |
| Version | v1.0 |
| Last updated | November 2024 |
What's inside
In the fast-paced world of finance, where numbers tell stories that can sway boardrooms or secure investments, having a reliable visual ally is non-negotiable. Enter the Excel Financial Growth Analysis PowerPoint template - a powerhouse designed to transform raw data into compelling narratives that drive decisions. Tailored for financial analysts, accountants, and business leaders who juggle quarterly reports, budget forecasts, and performance reviews, this template bridges the gap between spreadsheet complexity and slide simplicity. With 28 meticulously crafted diagrams, seven professional color schemes, three master slides, and three adaptable backgrounds, it equips you to handle everything from revenue trajectories to expense breakdowns with polished precision.
What sets this apart? Seamless Excel integration, allowing you to pull live data directly into charts for real-time updates - no more manual recalculations that eat into your prep time. Envision a bar graph slide that auto-refreshes with the latest sales figures, or a pie chart dissecting market shares in vibrant gradients that hold attention during high-stakes pitches. Compatible with PowerPoint 2016 and later, including .pptx and .potx formats plus .jpg previews, it's built for the modern workflow, whether you're in Microsoft 365 or standalone setups. For teams tired of bland defaults, this $22 investment delivers ROI through time saved and insights amplified.
Essential Features Powering Your Financial Visuals
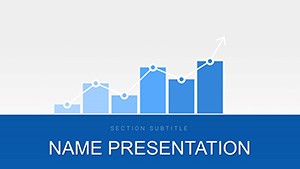
This template's backbone is its diagram library, where each of the 28 elements serves a specific financial storytelling need. From line charts tracking growth over quarters to waterfall diagrams revealing profit cascades, every piece is vector-based for infinite scalability without quality loss.
- Dynamic Chart Integration: Link slides to Excel sheets effortlessly, enabling formulas to flow into visuals - update one cell, and watch your entire deck synchronize.
- Color Scheme Flexibility: Seven palettes, from corporate blues for trust to energetic greens for growth, all customizable to match brand guidelines or report themes.
- Master and Background Options: Three masters ensure consistent headers with ticker-style footers for dates and metrics; backgrounds range from subtle grids for data-heavy slides to clean solids for executive summaries.
Included graphs and tables come pre-formatted for key metrics like CAGR or ROI, with placeholders for annotations that guide viewer focus without clutter.
Guided Workflow: Crafting a Quarterly Report Deck
- Import Your Data: Open the linked Excel file, input Q3 figures into designated tabs, and hit refresh to populate base diagrams like the revenue funnel.
- Customize Visuals: Select a combo chart slide, tweak axis labels for clarity, and apply a color scheme that highlights positive variances in bold accents.
- Layer Insights: Add text callouts to a dashboard slide, using the built-in shapes to spotlight anomalies, like a spike in operational costs.
- Finalize Flow: Animate data reveals sequentially for emphasis, then export to PDF for stakeholder shares - ensuring your narrative lands with impact.
This streamlined approach, akin to how firms like Deloitte streamline client deliverables, turns hours of drudgery into minutes of strategic refinement.
Targeted Use Cases for Finance Pros
Adaptability defines this template's value across scenarios. In investment pitches to venture capitalists, deploy the projection timeline to forecast five-year trajectories, with milestone markers for funding rounds. Budget meetings benefit from the variance analysis table, color-coding overruns in red for immediate flags. For annual performance reviews, the KPI scorecard slide aggregates metrics into a single-view powerhouse, fostering data-backed discussions.
Sales and marketing teams, often siloed from finance, find solace in the funnel visualization, mapping leads to conversions with drop-off insights. Even in risk assessments, the matrix diagram plots threats against impacts, empowering executives to prioritize with visual clarity. These applications address the universal frustration of data overload, distilling volumes into digestible stories that inform rather than overwhelm.
Pro Tips for Data-Driven Presentations
- Balance density: Limit slides to 3-5 data points max, using whitespace from the backgrounds to breathe life into figures.
- Leverage animations wisely: Fade in series data to build revelation, avoiding flashy effects that undermine credibility.
- Cross-verify links: Before presenting, test Excel connections on the target device to sidestep live glitches.
Such practices elevate your delivery, ensuring audiences grasp nuances like a CFO unveiling earnings calls.
Elevate Your Analytics Game Today
This PowerPoint template isn't merely a file - it's a catalyst for clearer communication in finance's high-wire act. By merging Excel's computational might with PowerPoint's persuasive polish, it empowers you to not just report numbers, but narrate futures. Secure yours for $22 and watch your presentations pivot from functional to formidable.
Frequently Asked Questions
How does Excel integration work in this template?
Charts link directly to an accompanying Excel workbook; edit data there, and updates reflect instantly in PowerPoint slides.
What PowerPoint versions are supported?
Fully compatible with PowerPoint 2016 and newer, including Microsoft 365 subscriptions.
Can I adjust the color schemes for branding?
Yes, all seven schemes are editable, with theme colors that propagate changes across the deck.
Are there placeholders for custom images?
Indeed, several diagrams include resizable frames for logos, photos, or infographics to personalize reports.
Is it suitable for team collaborations?
Perfect for shared editing via OneDrive or SharePoint, with locked masters to preserve design integrity.
How many diagrams does it include?
Twenty-eight, covering charts, tables, and timelines tailored to financial contexts.
Good for
- Project roadmaps and sprint plans
- Product launch timelines
- Quarterly or annual review decks
- Company history and milestone summaries
Licence
reviews
The icicle chart for hierarchical proportions is like a sunburst but rectangular.
The rectangles were too narrow at deep levels. Had to simplify my data.
Used for a file system visualization. The color coding helped.
The template didn't have a legend. Added one manually.
It’s okay. Not as pretty as a sunburst but easier to label.
FAQ
Will it work in Google Slides?
Are fonts embedded?
Can I use this for client work?
What's the refund policy?
Do you update the template after purchase?
Similar templates
See all PowerPoint Templates →


All 1 slides