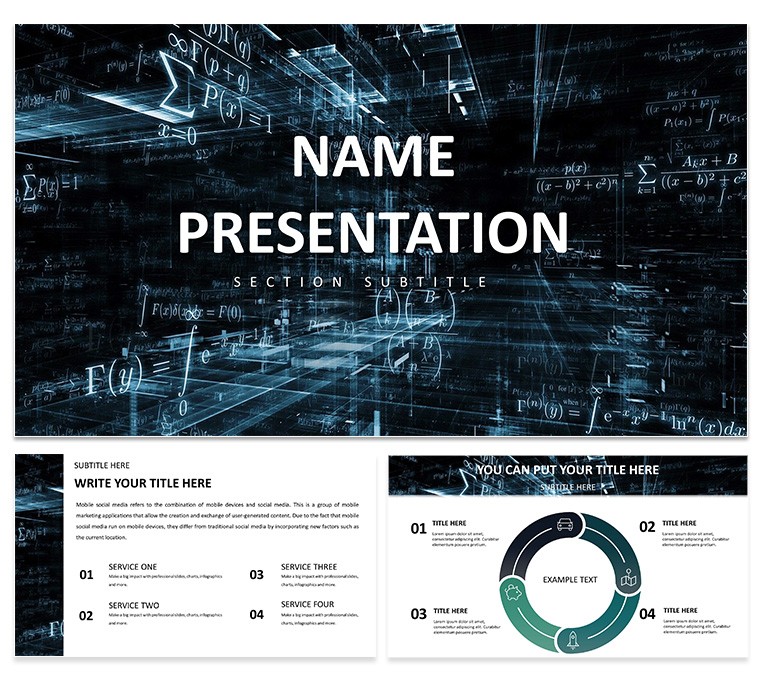
Data doesn't have to be a dense fog of numbers - it can form sharp, elegant patterns that guide decisions. The Abstract Geometric PowerPoint Template does just that, crafting a minimalist stage for data scientists, analysts, and tech leads to showcase insights with geometric grace. Boasting 28 abstract diagrams in 7 sleek color schemes, plus 3 master frameworks and 3 subtle backgrounds, it's your ally for unraveling algorithms, plotting trends, or modeling predictions in boardrooms or webinars.
Built for PowerPoint 2016 onward, its polyhedral charts and lattice infographics invite effortless morphs: resize nodes for emphasis, recolor edges to denote variables, or sequence reveals to trace data evolutions. This template transcends plain grids, echoing the clean lines of modern data viz tools like those in leading analytics firms, where abstraction clarifies chaos. Empower your audience to see the structure beneath the stats, turning presentations into portals of understanding.
Foundational Blocks: Features Shaping Smart Visuals
Geometry grounds the design, with masters for layered logics: one for exploratory scatters, another for relational webs, a third for temporal axes - unifying your data tale.
- 28 Geometric Diagrams: Hexagonal heatmaps for clustering or fractal trees for hierarchies - tailored to distill complexity, like vector fields for flow analytics.
- 7 Abstract Schemes: Monochrome for stark contrasts or prismatic for multidimensional pops, harmonizing across the deck with one click.
- Three Minimal Backgrounds: Grid fades for precision or void spaces for emphasis, keeping eyes on the geometries.
Vector purity means infinite scalability, ideal for 4K or print.
Constructing Your Data Edifice: A Layered Approach
Assemble in PowerPoint by unpacking the .pptx - immediate and intuitive. Align with the analytics master, then facet the title with project vectors and query hooks. For regression lines, select the angular plot: plot points, and morphs align trajectories fluidly.
- Blueprint Your Axes: Axis sections - queries, models, outcomes - aligning diagrams for logical lattice.
- Embed Dynamics: Wire in datasets or hyperlink to dashboards for live layers.
- Refine Edges: Calibrate transitions for phased unveils, vetting on monitors for acuity.
- Project Projections: Render to slideshare or PDF for archival angles.
This builds efficiency, prioritizing insight over infrastructure.
Vector Visions: Analytics in Action
An AI researcher might tessellate neural nets via the mosaic diagram, tiling layers to expose training depths. Consultants could prism sales forecasts, refracting scenarios for risk refractions. Educators use the spiral for iterative algorithms, coiling concepts progressively.
These vectors vector beyond basics, embedding math motifs like matrices for transformations - a cut above vanilla charts for nuanced narratives.
Angular Advice: Sharpening Your Geometric Edge
Honor minimalism: sparse labels, ample voids for contemplation. Pivot schemes for contexts - vibrant for discoveries, muted for audits. Layer legends sparingly, letting forms speak.
For teams, tag slides for modular mixes. It's geometry as gateway to genius.
Plot your path forward - acquire the Abstract Geometric PowerPoint Template for $22 and triangulate triumphs.
Frequently Asked Questions
What makes the diagrams abstract?
They use non-literal shapes like polygons to represent data relations, focusing on patterns over icons.
Can I link to external data sources?
Yes, integrate Excel or SQL pulls for dynamic updates within slides.
Is it suitable for beginner analysts?
Indeed - simple edits make complex viz approachable for all levels.
How do I export for web use?
Save as interactive HTML or animated GIF via PowerPoint's export options.
Are transitions geometry-friendly?
Prepped with linear wipes and rotates to echo structural shifts.
-

Geometrical Drawing PowerPoint Template
$10.00
•
JPG, POT, POTX
★ 3 (502)
-

Ruler for Drawing PowerPoint Template: Precision in Every Line
$10.00
•
JPG, POT, POTX
★ 2 (188)
-
Engineering drawing PowerPoint templates
$12.00
•
JPG, POTX
★ 5 (587)
-
Architectural project PowerPoint Presentation Template
$12.00
•
POTX
★ 5 (337)
-

Architectural Design PowerPoint presentation Template
$12.00
•
JPG, POTX, PPTX
★ 4 (94)
-
Architectural Plans Diagram - Fully Editable | ImagineLayout
$10.00
•
JPG, POTX, PPTX
★ 2 (545)
-

Architectural Company PowerPoint Template: Elevate Your Project Portfolios
$12.00
•
JPG, POTX
★ 4 (700)
-

New Architecture Projects PowerPoint Template
$10.00
•
JPG, POT, POTX
★ 4 (835)
See more in Neutral - Abstract PowerPoint template →