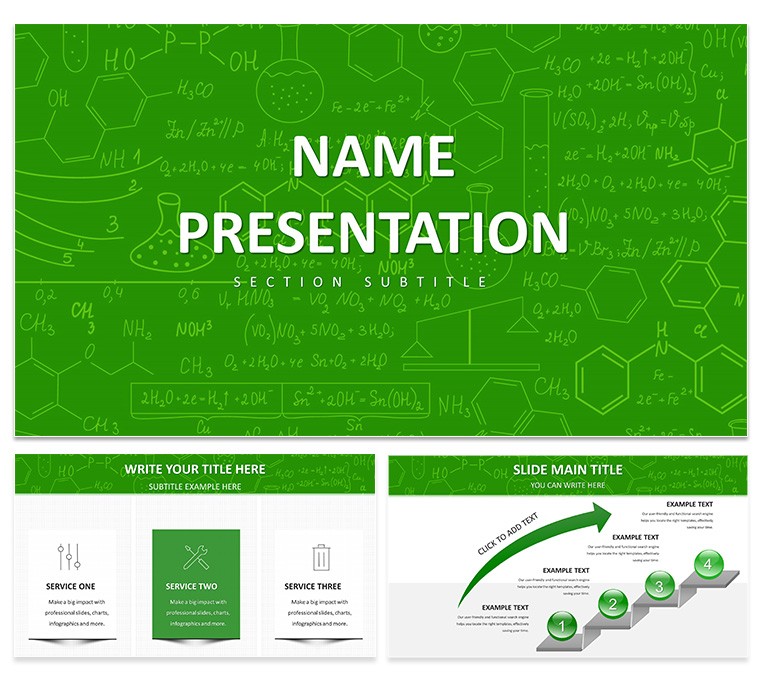
Ever stared at a stack of lab data, wondering how to make it sing instead of drone? The Chem Lab Report PowerPoint Template turns that chore into a craft, equipping researchers, professors, and students with a structured yet flexible framework for unveiling experiment insights. With 28 diagrams spanning three masters and backgrounds, it captures the essence of scientific inquiry - from hypothesis setup to conclusion draws - in a clean, lab-coat-ready aesthetic. Priced at $22, this tool distills chaos into clarity, helping you present titration curves or spectral peaks with the poise of a seasoned analyst. It's for those moments when your findings deserve a spotlight that highlights rigor without the fuss.
The template's neutral palette, accented by precise blues and grays, evokes sterile benches and bubbling flasks, while its layouts ensure logical flow: methods before madness, results before revelations. Seven color variants allow personalization, like warming tones for biochemistry reports, all editable in PowerPoint 2016 and beyond for effortless iteration.
Key Building Blocks for Lab-Ready Presentations
Crafted with the scientific method in mind, these features ensure your report doesn't just document - it demonstrates.
- 28 Methodical Diagrams: Tailored for lab narratives, including flowcharts for procedural sequences, bar graphs for yield comparisons, and scatter plots for error analysis - each with grid-aligned placeholders for raw data.
- Seven Adaptable Color Schemes: Shift from cool lab whites to vibrant reaction reds; themes apply uniformly, maintaining cohesion as you layer in observations.
- Intuitive Editability: Ungroup tables for cell-by-cell tweaks, or recolor error bars to denote replicates - native PowerPoint handles ensure no compatibility hiccups.
- Streamlined Package: POTX for customization, PPTX for ready-use, JPGs for quick refs - lightweight at 9MB, perfect for emailing to advisors.
A grad student once streamlined a kinetics report with its sequential timeline, condensing weeks of trials into slides that earned committee nods.
Elevating Reports Above Standard Spreadsheets
Excel dumps into PowerPoint? They scream "amateur hour." This template professionalizes the pivot, with pre-built axes calibrated for lab scales and legends that auto-populate variable keys. It sidesteps the tedium of manual alignments, letting you focus on interpreting anomalies, like unexpected pH shifts in enzyme assays.
Collaboration shines here too - share the master file for peer input on discussion slides, with changes syncing without style breaks. Subtle fades reveal statistical significance, turning dry stats into storytelling beats.
Your Roadmap to Report Mastery
- Launch the Lab: Unzip your $22 download and open POTX; select a grid background for data-centric sections.
- Outline the Experiment: Populate a methods flowchart with bullet steps; hyperlink to appendices for raw spectra.
- Visualize Findings: Drop datasets into column charts - watch confidence intervals shade in automatically for robust visuals.
- Conclude with Impact: Use summary infographics to tie threads; export to high-res PDF for thesis submissions.
Insight: Embed hyperlinks in result tables to toggle between raw and normalized views, keeping audiences oriented.
From Classroom to Conference: Versatile Lab Applications
This template bridges educational and professional divides, powering everything from freshman demos to journal club critiques.
Student Project Showcases
High schoolers mapping distillation fractions via layered funnel diagrams gain confidence, their processes laid bare for teacher feedback.
Professional Audit Summaries
Industry chemists recap quality controls with pie charts dissecting impurity profiles, driving process tweaks with data-driven persuasion.
In each, the template's structure mirrors the scientific cycle, fostering discussions that deepen understanding.
Transform your next lab recap from rote to riveting - invest $22 in the Chem Lab Report PowerPoint Template and let your results resonate.
Frequently Asked Questions
Can I import data from lab software?
Yes, paste from tools like Origin or Excel directly into chart placeholders for instant formatting.
Are there templates for specific experiment types?
The 28 diagrams cover broad categories, from chromatography to calorimetry, adaptable as needed.
How do I add units to axes?
Use the chart tools to label axes precisely, with auto-formatting for superscripts like mol/L.
What's the file size impact?
Minimal - adds under 9MB, keeping decks agile for large audiences.
Does it support group editing?
Perfectly, via OneDrive integration for real-time lab team refinements.