Unlock the universe's secrets one slide at a time with the Scientific PowerPoint Template, infused with mathematical symbols and physics diagrams that bring theory to vivid life. Geared toward researchers, educators, and engineers grappling with quantum quirks or calculus conundrums, this template turns formidable formulas into approachable adventures. From lecture halls echoing with relativity discussions to lab meetings dissecting wave functions, it's your ally in articulating the abstract.
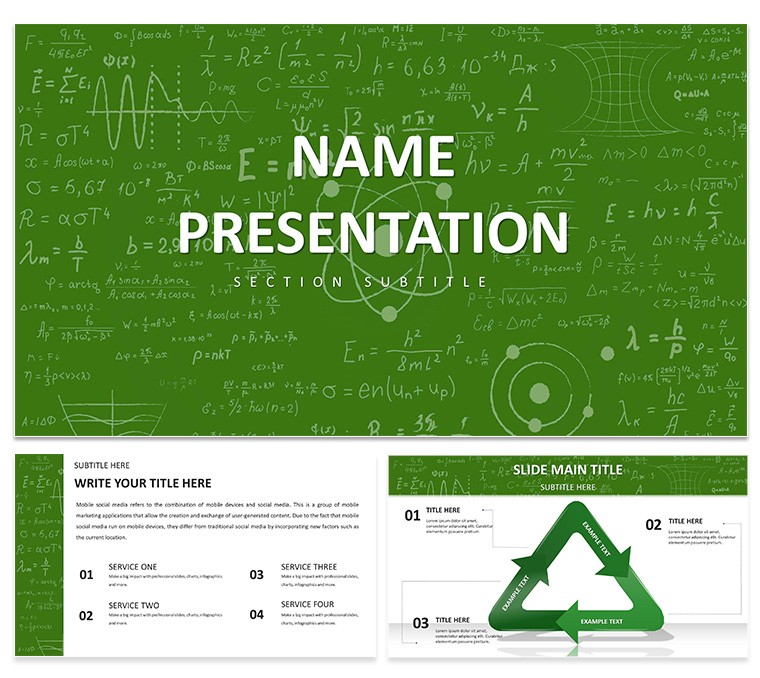
Packaged with 28 diagrams, seven color schemes, three masters, and three backgrounds, every asset is editable and PowerPoint-ready from 2016 up. Visualize a professor graphing orbital mechanics with elliptical paths that orbit your points, or an engineer modeling stress tensors via grid overlays - precision meets presentation prowess. This design demystifies complexity, fostering understanding over intimidation.
In academia's high-stakes arena, where clarity can catalyze collaborations, this template stands as a beacon. It addresses the eternal challenge: conveying profundity without perplexity. Secure it for $22 today and propel your scientific discourse forward.
Fundamental Features: The Physics of Design
Grounded in scientific accuracy, the template's toolkit includes diagrams that echo lab instruments and theorem proofs, all scalable for your scope.
- Editable Physics Icons: From pendulums to particles, adjust trajectories and vectors to mirror simulations.
- Seven Color Schemes: Stark contrasts for dark-mode proofs or soft hues for theoretical explorations.
- Three Masters: Aligned for problem statements, derivations, and verifications.
- Background Options: Subtle equation fades or clean whites to spotlight your science.
These converge to craft slides that compute credibility at first glance.
Theoretical Applications: Theorems in Practice
Where equations meet audiences, this template theorems success. A physicist might deploy it for particle collision analyses, with scatter plots tracing trajectories. In engineering seminars, vector fields map fluid dynamics, clarifying flows for cross-disciplinary teams.
Mapping the Diagrams: From Axioms to Applications
Page 1 launches with a symbolic title frame, embedding your core equation. Advance to Page 4's coordinate grids for function plotting - input variables to curve live. Core diagrams, Pages 11-19, encompass circuit schematics and force diagrams, editable resistors symbolizing variables in Kirchhoff's laws.
Page 28 culminates in a multidimensional matrix, ideal for tensor summaries. Hack: Integrate LaTeX-rendered math via add-ins for seamless notation.
- Align symbols using snap-to-grid for theorem precision.
- Animate derivations step-by-step, unveiling integrals progressively.
- Batch-edit colors across proofs for thematic unity.
This methodical march makes mastery accessible.
Lab Lectures and Beyond
For student theses, simplify waveforms for signal processing intros; for peer reviews, amplify fractals in chaos theory. Superior to generic graphs, its specialized symbols - like Hamiltonian operators - lend authenticity, bridging textbook to talk.
Deriving Customization: Your Formula for Fit
Instigate with master selection; schemes propagate logically. Hone diagrams through format panes - rotate axes for polar coords or layer transparencies for interference patterns. Sync with MATLAB outputs or embed GeoGebra applets for interactive proofs.
Pro insight: Use background equations as watermarks, fading for focus. Transform theory into tailored talks swiftly.
Resonances from Research: Waves of Wisdom
A quantum lecturer praised its role in entanglement visuals, where linked particles mirrored paired concepts for breakthrough buy-in. An applied math prof found vector bundles clarified optimization puzzles in grad seminars.
These harmonics highlight the template's theorem: design drives discovery.
Calculate your next win - download the Scientific PowerPoint Template for $22 and equation excellence.
Frequently Asked Questions
Supports math notation?
Yes, dedicated fields for symbols and equations, integrable with equation editors.
Color options for print?
Seven include grayscale-friendly sets for high-fidelity prints.
Suitable for engineering?
Perfectly, with diagrams for mechanics and circuits.
Animation for physics demos?
Prepped paths for motion; customize for parabolic arcs.
Number of diagram types?
28 varied, from graphs to symbolic layouts.