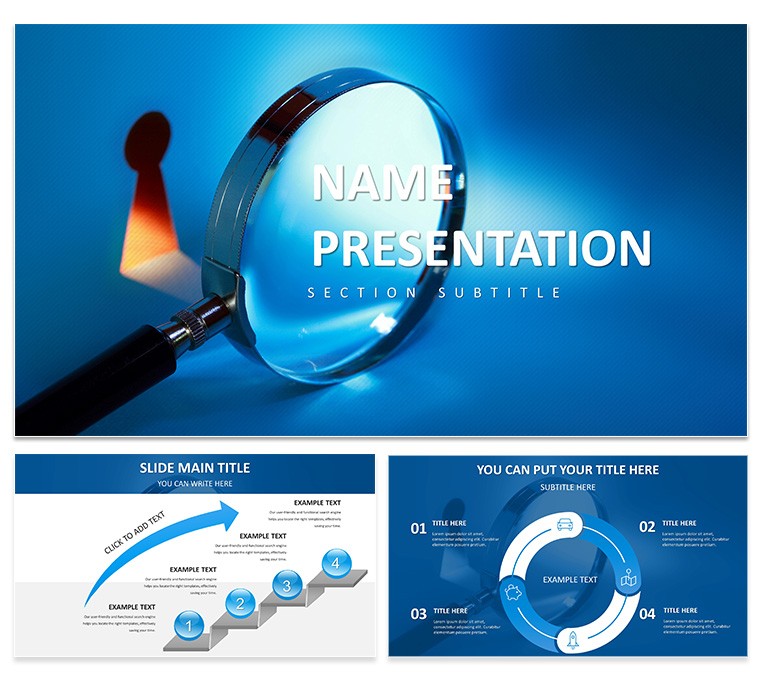
In the fast-paced world of consulting, where every slide can make or break a client's buy-in, you need visuals that cut through the noise and illuminate the path forward. Enter the In-Depth Analysis PowerPoint Template - a robust toolkit crafted for those who turn raw numbers into narrative gold. Whether you're a business analyst dissecting market trends, a data scientist unveiling predictive models, or a strategy consultant mapping competitive landscapes, this template equips you to deliver clarity amid complexity.
Boasting 28 meticulously designed diagrams across seven professional color schemes, it features a sleek, minimalist aesthetic that lets your insights take center stage. Fully compatible with all PowerPoint versions, it's your shortcut to polished presentations that resonate, helping stakeholders grasp correlations and forecasts without the fog of cluttered charts.
Essential Tools for Precision Storytelling
The template's strength lies in its logical progression of slide types, starting with an executive summary dashboard that condenses key metrics into at-a-glance gauges and sparklines. Imagine presenting quarterly revenue dips: a layered funnel diagram reveals bottlenecks, with editable segments highlighting supply chain tweaks that could reclaim lost margins.
Diving deeper, the correlation matrix slide stands out for its grid-based visuals, perfect for showcasing variable interplays - like how marketing spend influences customer acquisition. Consultants often pair this with the SWOT analysis wheel, rotating sections to emphasize strengths in client pitches, making abstract strategies feel tangible and actionable.
- Data Visualization Variety: From Sankey diagrams tracing resource flows to heat maps spotting regional variances, each tool adapts to your dataset.
- Insight Extraction Aids: Bullet hierarchies with embedded icons for qualitative notes, ensuring balanced quantitative-qualitative narratives.
- Forecasting Frames: Timeline projections with milestone markers, ideal for scenario planning in boardroom battles.
These elements aren't mere placeholders; they're frameworks that guide your audience through the 'why' behind the 'what,' fostering trust in your recommendations.
Practical Scenarios: Bringing Analysis to Life
Picture a research firm wrapping up a consumer behavior study. Using the template's process flowcharts, you map survey data from collection to conclusions, with decision nodes branching into persona profiles. Clients nod along as animations peel back layers, revealing how demographics drive purchasing patterns - much like how firms in competitive bids use these to differentiate their depth.
For internal strategy sessions, the benchmarking slide compares KPIs side-by-side, using bar stacks to contrast your performance against industry peers. A project manager might leverage this to justify budget reallocations, with callout boxes for variance explanations that spark focused debates rather than confusion.
- Gather and Segment Data: Import your spreadsheets directly, then assign visuals - line graphs for trends, bubbles for multi-variable plots.
- Refine for Relevance: Trim extraneous axes on scatter plots to zoom on outliers, keeping the focus laser-sharp.
- Rehearse Delivery: Time reveals on pivot tables to sync with your spoken insights, building suspense around pivotal findings.
In academic collaborations, researchers appreciate the literature review timeline, threading citations through a Gantt-style layout to contextualize your work within the field.
Customization and Workflow Harmony
Seamless integration starts with the three master slides, where you embed brand fonts and logos once for universal application. The seven color schemes range from cool blues for objective reports to warm accents for persuasive decks, all vector-based for crisp scaling.
Pro customization tip: Link dynamic charts to live data sources via PowerPoint's embed features, updating visuals in real-time during reviews. Versus generic tools, this template's pre-built accessibility - alt text prompts on images, high-contrast options - ensures inclusivity without extra effort.
It's the difference between a functional report and a compelling case that drives decisions. Secure your edge in analysis presentations - download for $22 and start decoding data with confidence.
Frequently Asked Questions
Is it compatible with older PowerPoint versions?
Yes, it works with all versions, including 2010 and later, for broad accessibility across teams.
How editable are the diagrams?
All 28 diagrams are fully vector-editable, letting you resize, recolor, and relabel without quality loss.
Does it support data imports?
Absolutely, charts link easily to Excel for automatic updates, streamlining your analysis workflow.
Are there animation presets?
Yes, subtle entrance effects are included, customizable to match your pacing needs.
Can I use it for client reports?
Definitely, its professional design is tailored for high-stakes consulting deliverables.
What support is available?
24/7 assistance ensures any tweaks or questions are handled promptly.