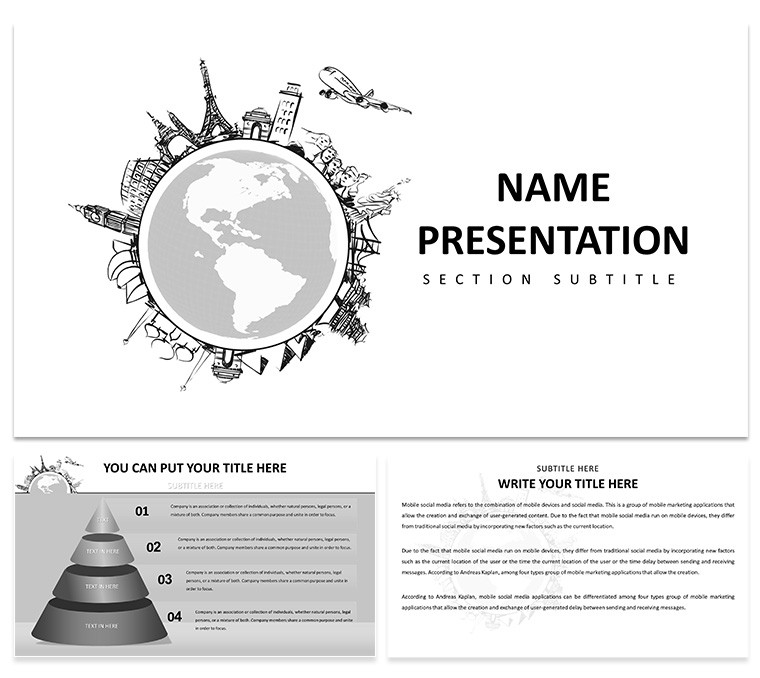
Imagine standing before a room full of potential partners, your slides unfolding like a world map under spotlights, each diagram pulling them into stories of distant markets and untapped opportunities. That's the magic of the Around the World PowerPoint template - a free, ready-to-use toolkit designed for anyone bridging borders through presentations. Whether you're a travel agency plotting dream itineraries, a business leader charting international expansion, or an educator mapping cultural exchanges, this template turns flat data into vivid journeys. With its globe-centric visuals, iconic landmarks subtly woven into layouts, and flexible structures, it helps you craft narratives that resonate across time zones.
At its core, this template offers three master slides that set a consistent, worldly tone - think clean lines evoking flight paths or ocean currents. Layered with three background options, from subtle earth tones to vibrant cultural motifs, it adapts to your story's vibe. Dive deeper, and you'll find 28 meticulously crafted diagrams, each a building block for your message. From interconnected network charts symbolizing global supply chains to timeline arcs tracing historical trade routes, every element is editable down to the finest detail. Switch among seven color schemes to match your brand or the mood of your pitch, ensuring your slides feel as dynamic as the topics they cover.
Navigating Global Narratives with Precision
Crafting a presentation on international trends shouldn't feel like plotting a course without a compass. This template simplifies the process, starting with slide one: a sweeping world map infographic where you can highlight key regions with just a few clicks. Drop in your data points - say, market growth stats for Asia-Pacific - and watch the vectors adjust seamlessly, no design degree required. Move to the process flow diagrams on slides 5 through 8, perfect for outlining expansion steps, like from market research to local partnerships. Each arrow and node pulls double duty, visually linking phases while keeping text minimal for that high-impact feel.
For those cultural deep dives, slides 12 to 15 shine with layered icon sets - think Eiffel Tower silhouettes for European outreach or pagoda outlines for Asian ventures. Customize these by swapping colors or scaling sizes, then pair them with radial charts to show influence spreads, much like how a single TEDx talk on cross-cultural leadership can ripple worldwide. And don't overlook the comparison matrices in slides 20-22; they're ideal for stacking pros and cons of entering new territories, with built-in animations that reveal insights progressively, holding attention like a well-timed reveal in a documentary.
Step-by-Step: Building Your First Global Pitch
- Select Your Base: Open the .pptx file in PowerPoint 2016 or later - it's fully compatible, no plugins needed. Choose a master slide that echoes your theme, like the azure blue for oceanic trade routes.
- Populate Key Diagrams: Head to the world connectivity slide (diagram 3). Input your network data via the linked Excel sheet, and let the smart layouts auto-adjust connections.
- Infuse Personality: On itinerary timelines (slides 9-11), drag in your photos or icons from the built-in library, resizing effortlessly to fit narrative beats.
- Polish and Animate: Apply a color scheme - try the emerald greens for sustainability-focused global stories - then add subtle fades to transitions for a globe-spinning effect.
- Rehearse and Export: Test on different screens; the vector-based elements scale perfectly. Export as PDF for handouts or video for virtual shares.
This workflow cuts prep time, letting you focus on what matters: delivering insights that spark decisions. Picture a marketing director at a tourism board using these exact slides to pitch eco-tour routes - maps highlighting protected zones, charts projecting visitor upticks, all flowing into a call for collaborative funding. It's not just presentation; it's persuasion wrapped in wanderlust.
Real-World Journeys: Where This Template Takes You
In the hands of event planners, it transforms conference agendas into passport stamps, with agenda wheels (slide 18) circling sessions by continent. For sales teams eyeing exports, the pyramid hierarchies (slides 23-25) break down market entry layers, from regulatory hurdles to consumer preferences, visualized as ascending peaks. Educators might leverage the scatter plots for demographic distributions, plotting student exchanges or migration patterns with pinpoint accuracy.
Consider a logistics firm presenting supply chain resilience: Start with a central hub diagram radiating to ports worldwide, then layer in risk icons - storm clouds over volatile routes - that fade in to underscore contingency plans. Or, for nonprofit fundraisers, the balance scale visuals weigh impact metrics against budgets, turning abstract aid stats into compelling equity stories. Each application underscores the template's versatility, proving it's more than slides - it's a launchpad for ideas that cross oceans.
Beyond basics, integrate it with tools like Google Earth for embedded 3D views or Canva for quick icon tweaks, though the built-ins cover 90% of needs. Users rave about how the thematic consistency elevates amateur efforts to pro levels, much like how National Geographic photographers frame shots to tell untold tales.
Why This Free Gem Stands Out from Stock Options
Unlike generic PowerPoint defaults, which often leave you wrestling with misaligned shapes, this template's pre-vectored elements snap into place, saving hours on tweaks. No more pixelated maps from clipart; here, everything scales crisply for 4K projectors or mobile views. And while free alternatives might skimp on variety, these 28 diagrams span radial, linear, and hierarchical formats, covering everything from SWOT globes to Venn overlaps for alliance mapping.
It's backed by designs tested in real boardrooms - from UN summits to startup accelerators - ensuring podium-ready polish. Compatible across Windows and Mac, it plays nice with Office 365 updates, too. Download your free copy today and chart courses that captivate.
Frequently Asked Questions
Can I use this template for commercial projects?
Yes, the free license allows full commercial use, including client pitches and reports, as long as you don't resell the template itself.
How do I change the color schemes?
Simply select a diagram, go to the Design tab in PowerPoint, and choose from the seven predefined schemes - changes apply globally for consistency.
Is it editable in Google Slides?
While optimized for PowerPoint, you can import the .pptx file into Google Slides, though some animations may need manual adjustments.
Are there instructions included?
The download includes a quick-start guide PDF with tips on customizing masters and diagrams.
Can I add my own images?
Absolutely - drag and drop into placeholder frames; the layouts auto-resize to maintain balance.
What if I need more slides?
Duplicate any diagram slide and tweak as needed; the masters ensure new ones blend seamlessly.