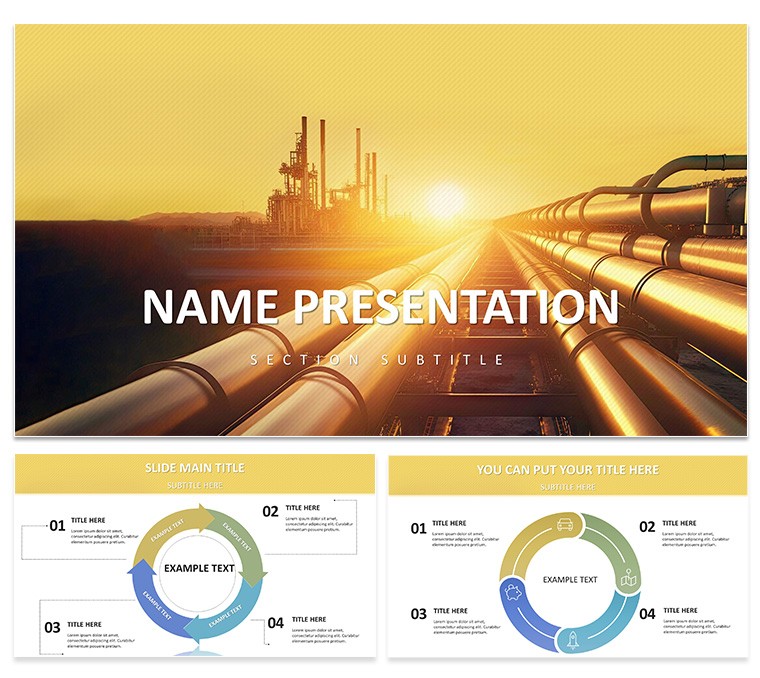
Imagine standing in a boardroom, facing executives who need to grasp your factory's efficiency metrics at a glance. That's where the Versatile Industrial PowerPoint Template steps in, turning raw production data into polished, persuasive stories. This template packs 28 ready-to-use diagrams across three master slides and backgrounds, all with seven flexible color schemes to match your company's steel-gray branding or vibrant safety hues. Whether you're an engineer mapping assembly lines or a project manager updating timelines, these slides make technical details feel approachable and authoritative.
Designed for the hands-on world of manufacturing and engineering, this PowerPoint tool goes beyond basic charts. It includes infographics for process flows, bar graphs for output comparisons, and timelines that trace project milestones with precision. Every element is fully editable in PowerPoint 2016 and later versions, so you can swap icons for gear motifs or adjust fonts to your team's sans-serif standard. The result? Presentations that not only inform but inspire confidence in your operational strategies, much like how leading firms use visual clarity to secure multimillion-dollar contracts.
Unlocking Key Features for Industrial Precision
Dive into the template's core strengths, starting with its diagram variety. Slide one kicks off with a customizable funnel chart, perfect for illustrating material throughput from raw inputs to finished goods. Resize the stages, recolor for hazard zones, or add annotations for bottlenecks - it's all drag-and-drop simple.
- Process Flow Infographics: Seven layouts trace workflows, from supply chain overviews to quality control checkpoints, helping you highlight efficiencies without overwhelming viewers.
- Data-Driven Charts: Bar, pie, and line varieties let you compare quarterly yields or forecast downtime, with built-in animations that reveal insights progressively.
- Timeline Masters: Horizontal and vertical options mark Gantt-style progress, ideal for construction phases or maintenance schedules.
- Icon Libraries: Over 50 industrial symbols - pistons, blueprints, hard hats - ensure thematic consistency without hunting for clipart.
Customization shines here too. Open in PowerPoint, select a slide, and tweak the theme colors via the Design tab. For a safety-focused deck, shift to red accents; for sales pitches, opt for metallic blues. These features save hours, letting you focus on strategy rather than styling.
Real-World Applications: From Factory Floor to Executive Suite
Picture a product launch for a new turbine line. Use the template's radial diagram to showcase component integration, layering in cost breakdowns and performance specs. A sales VP might adapt the comparison matrix slide to pit your machinery against competitors, using side-by-side visuals that underscore reliability edges.
For operational reports, the step-by-step guide below transforms a weekly update into a narrative powerhouse:
- Assess Your Data: Gather metrics like production rates or defect logs - ensure they're in Excel for easy import.
- Select Slide Base: Choose a master slide that fits, like the grid layout for multi-metric dashboards.
- Input and Visualize: Paste data into charts; the template auto-adjusts scales for clarity.
- Add Narrative: Overlay text boxes with key takeaways, such as "20% uptime boost post-upgrade."
- Rehearse Flow: Test animations to build suspense, revealing regional breakdowns last for global impact.
In training sessions, educators leverage the modular icons to build interactive quizzes on safety protocols, fostering engagement that sticks. Consultants, meanwhile, repurpose the SWOT analysis slide for client audits, embedding photos of site visits for tangible proof. This template adapts seamlessly, proving its worth in diverse scenarios from shop floor briefings to investor roadshows.
Customization Tips: Tailor to Your Industrial Edge
To maximize impact, start with consistency. Align all diagrams to your brand guidelines - perhaps incorporating hex codes from your logo for that unified look. For complex datasets, layer in SmartArt equivalents; the template's vectors scale without pixelation, even on large projectors.
A pro tip: Integrate hyperlinks within timelines to jump to detailed appendices, keeping main slides lean. If presenting virtually, test on Teams or Zoom - the subtle gradients ensure readability on smaller screens. Compared to vanilla PowerPoint shapes, this template's pre-built elements cut design time dramatically, freeing you to refine your delivery.
Engineers appreciate the precision: Edit node points on flowcharts to reflect exact machinery sequences, or animate paths to simulate assembly motion. It's like having a digital drafting table at your fingertips, blending technical accuracy with visual flair.
Why This Template Stands Out in Manufacturing
In a field where clarity can mean compliance or catastrophe, this template excels by prioritizing function over flash. Unlike generic designs that dilute your message with unrelated motifs, every slide here reinforces industrial themes - think riveted edges and blueprint lines subtly woven into backgrounds. It's compatible across Windows and Mac, with no plugins needed, making it a reliable choice for cross-team collaborations.
Users in heavy industry often share how it elevates routine updates into strategic dialogues. One project lead noted adapting the pyramid chart for resource allocation, turning a dry budget review into a roadmap for expansion. Download this Versatile Industrial PowerPoint Template for $22 and experience how professional visuals can fortify your presentations, driving decisions with data that demands attention.
Frequently Asked Questions
What file formats are included with this template?
The template comes in .pptx for direct editing, .potx for master reuse, and .jpg previews for quick shares.
Can I use this on older PowerPoint versions?
It's optimized for 2016 and newer; for earlier, export to PDF to preserve layouts.
Are the diagrams vector-based for resizing?
Yes, all elements are scalable vectors, ensuring crisp quality at any zoom level.
How do I change color schemes quickly?
Access via the Variants menu in Design tab - switch between seven schemes in one click.
Is it suitable for non-manufacturing industries?
Absolutely; the neutral structures adapt well to logistics or energy sectors too.