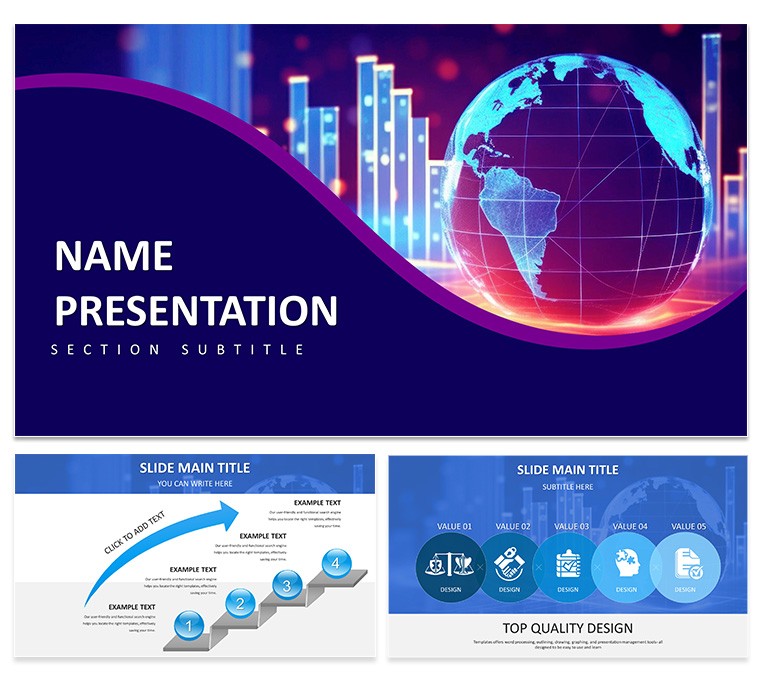
Navigating international markets demands more than spreadsheets - it calls for visuals that bridge continents and cultures. Enter the Focusing on Global Reach and Data Visualization PowerPoint Template, a powerhouse of 28 diagrams spanning three masters and backgrounds, accented by seven color schemes that evoke oceanic blues or terrestrial greens. Tailored for executives charting expansion, this tool weaves data into global tapestries, making metrics from Tokyo to Toronto resonate universally.
From interactive globe maps to layered infographics, every slide is a canvas for your story. Editable in PowerPoint 2016+, swap continental highlights or embed KPIs with ease, ensuring your deck reflects precise projections. It's the secret weapon for turning scattered stats into strategic symphonies, akin to how multinational leaders distill annual reports into digestible dashboards.
Essential Features: Mapping Data to Impact
The template's strength lies in its geospatial savvy. Lead with a rotatable world map slide, where heat maps denote market saturation - color-code by revenue tiers for instant insights.
- Globe-Centric Maps: Projections for trade routes or demographic overlays, with pins for key locales.
- Infographic Suites: Flowcharts linking supply chains across borders, animated to trace journeys.
- Chart Collections: Scatter plots for correlation analysis or area graphs for trend spans, all globally scaled.
- Symbol Sets: Cultural icons and flags for inclusive, region-specific emphasis.
Adaptation is effortless: Use the Format Painter to unify styles, or insert live web data for currency fluctuations. These elements ensure your presentation scales from local teams to global stakeholders.
Practical Applications: Scenarios That Span the Globe
Consider a marketing director pitching Q4 strategies. Employ the radial world chart to radiate campaign reach, segmenting by engagement rates per hemisphere. Researchers could harness the timeline matrix for historical trade evolutions, plotting events with flagged impacts.
Build an analyst report with this sequence:
- Gather Global Inputs: Compile datasets from sources like World Bank APIs.
- Choose Geo-Fit Slides: Select map-based for spatial data, charts for numerics.
- Layer Insights: Add trend lines; the template's grid aligns for precision.
- Contextualize: Bullet regional nuances in adjacent text fields.
- Validate Reach: Animate reveals to pace information, avoiding overload.
Educators in international relations use it for seminar visuals, mapping alliances with connected node graphs. Nonprofits adapt for impact reports, visualizing aid distributions to rally donors. Its breadth covers corporate growth talks to academic deep dives.
Expert Customization: Fine-Tuning for Frontier Frontiers
For peak performance, calibrate projections to Mercator or equal-area based on your focus - edit via shape properties for distortion-free views. Link charts to external tables for dynamic updates, a boon for live demos.
Tip: Embed hyperlinks to source footnotes, bolstering credibility. Outshining basic PowerPoint maps, this template's pre-rendered assets load faster, ideal for bandwidth-challenged venues. Data analysts favor the conditional formatting echoes, auto-shading variances for at-a-glance alerts.
Why It Defines Global Data Excellence
In an interconnected era, this template distinguishes by merging cartography with clarity - subtle latitude lines frame data without fanfare, unlike generic globes that generalize. Cross-compatible and lightweight, it suits diverse devices from laptops to conference walls.
One consultant highlighted its utility in sealing a cross-border merger pitch. Acquire the Global Reach PowerPoint Template for $22 - download today and chart courses that connect, convince, and conquer.
Frequently Asked Questions
Can maps be customized for specific regions?
Yes, isolate continents or zoom via editable paths and fills.
What chart types support geospatial data?
Primarily scatter and bubble, with overlays for latitude/longitude.
Is the design responsive for different screen sizes?
Vector-based, so it adapts cleanly to 4:3 or 16:9 ratios.
How to integrate real-time data?
Link to Excel or Google Sheets for automatic refreshes.
Suitable for educational use?
Perfectly; clear labels and scalable elements aid teaching.