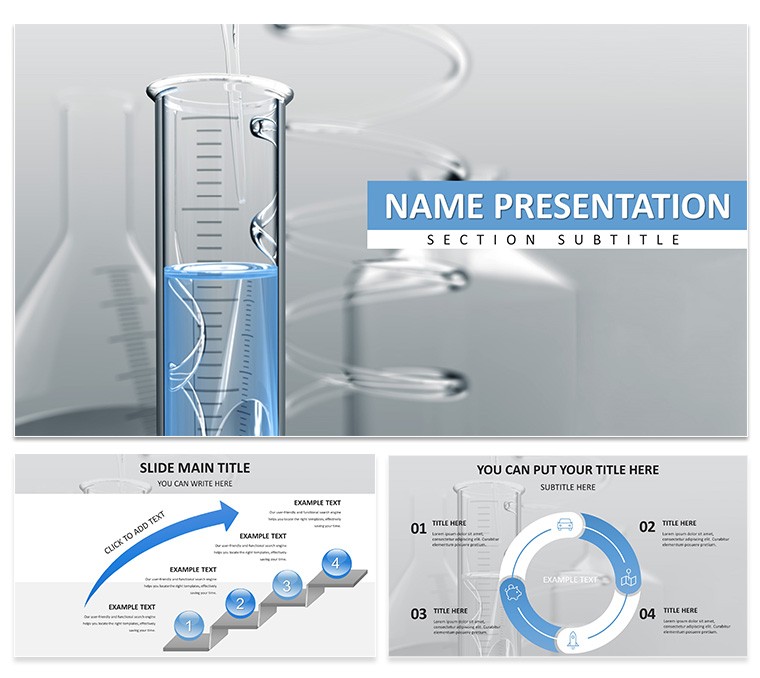
Imagine standing before a room of fellow scientists at a bustling conference, your slides cutting through the jargon like a precise lab instrument. That's the power of the Scientific Discovery PowerPoint Template - a curated collection of 28 editable diagrams designed to turn dense research findings into crystal-clear visuals that captivate and convince. Whether you're unveiling breakthrough methodologies or mapping out experimental timelines, this template strips away the clutter, letting your discoveries shine. Tailored for researchers, professors, and science communicators, it equips you with tools to handle everything from hypothesis breakdowns to result interpretations, all while maintaining a professional, lab-ready aesthetic.
Crafted with the rigors of academic and corporate science in mind, this template goes beyond basic slides. It includes three master layouts for consistent branding, three versatile backgrounds to suit light or dark room settings, and seven color schemes that adapt to your institution's palette or the theme of your talk. Each of the 28 diagrams - ranging from flowcharts for process overviews to layered infographics for data hierarchies - is fully vector-based, ensuring they scale perfectly without pixelation during edits. Forget wrestling with default PowerPoint shapes; here, every element snaps into place, saving you hours on formatting so you can focus on refining your narrative.
What sets this apart is its intuitive nod to scientific storytelling. Picture a slide where your PCR amplification steps unfold in a sequential timeline, complete with icon placeholders for reagents and outcomes - ideal for grant proposals where clarity wins funding. Or consider the radial charts for ecosystem impact studies, where variables like biodiversity metrics radiate from a central node, making interconnections pop. This isn't just a template; it's a scaffold for turning raw data into persuasive arguments, much like how seasoned presenters at events like TEDxScience use visuals to bridge the gap between lab benches and boardrooms.
Unlocking the Core Features of Your Scientific Slides
Dive deeper into what makes these 28 diagrams indispensable. Start with the core infographic set: eight slides dedicated to process mapping, including cycle diagrams for iterative experiments and pyramid structures for hierarchical findings. These aren't static images; they're editable canvases where you can swap in your own photos of gel electrophoresis results or tweak node labels for specific hypotheses.
- Vector Icons and Symbols: Over 50 science-themed icons, from DNA helices to atomic models, ready to drag-and-drop for instant relevance.
- Chart Variety: Bar graphs for comparative analyses, scatter plots for correlation visuals, and pie charts segmented for resource allocation in projects - all pre-formatted with gridlines that align effortlessly.
- Customization Ease: Layered Photoshop files accompany the PPTX for advanced tweaks, while the POTX master ensures theme-wide changes ripple across every slide.
For compatibility, it works seamlessly with PowerPoint 2016 and later versions on Windows or Mac, exporting cleanly to PDF for journal submissions. Priced at just $22, it's an investment that pays off in every polished presentation you deliver.
Real-World Applications: From Lab to Lecture Hall
Envision a graduate student prepping for their thesis defense. With this template, they layer in a Gantt chart slide to timeline their fieldwork phases, adding milestones like sample collections and statistical runs. The result? A defense that flows logically, with each slide building on the last to underscore the thesis's validity. Or take a corporate R&D lead sharing quarterly innovations: a dashboard-style slide aggregates KPI metrics from multiple trials, using heat maps to highlight success zones - turning what could be a dry report into a dynamic strategy session.
Step-by-Step: Crafting a Conference-Worthy Methodology Slide
- Select Your Base: Choose the flowchart diagram from the masters, ensuring it matches your color scheme for a cohesive look.
- Input Data: Drag in text boxes for each step - say, "Literature Review" to "Peer Validation" - and insert relevant icons like a magnifying glass for searches.
- Visualize Connections: Use the built-in arrows to link steps, adjusting curvatures for emphasis on critical junctures like ethical approvals.
- Enhance with Media: Embed a photo of your setup or a simple animation for transitions, then test in slideshow mode for smooth reveals.
- Refine and Export: Align elements via the grid, proof for accessibility (high-contrast text), and save as PPTX for collaboration.
This approach not only streamlines your prep but also models best practices for your audience, fostering deeper engagement. In educational settings, professors adapt these for interactive lectures: a Venn diagram slide dissects overlapping theories in evolutionary biology, prompting student discussions right from the projection.
Tailored Tips to Maximize Impact
To elevate your delivery, pair these slides with subtle animations - fade-ins on data points keep eyes tracking without overwhelming. For virtual formats like Zoom seminars, leverage the template's high-res JPG exports for screen shares that remain sharp. Remember, consistency is key: stick to one color scheme per presentation to reinforce recall, as seen in award-winning decks from organizations like the American Association for the Advancement of Science.
Compared to vanilla PowerPoint builds, this template cuts design time by embedding ready-to-use elements, letting you iterate faster on content revisions. It's particularly potent for interdisciplinary talks, where blending biology visuals with tech infographics bridges audience divides.
Ready to illuminate your next discovery? Download the Scientific Discovery PowerPoint Template today for $22 and watch your ideas resonate.
Frequently Asked Questions
What formats are included with the template? You'll get PPTX for full editing, POTX for masters, and JPG previews for quick references.
Can I use this on Mac? Yes, fully compatible with PowerPoint for Mac 2016 and newer.
Are the diagrams resizable without quality loss? Absolutely, thanks to vector graphics that scale infinitely.
How do I change the color scheme? Select a master slide, apply one of the seven schemes, and it updates all diagrams automatically.
Is there support for animations? The base slides are static for flexibility, but you can add PowerPoint's built-in animations easily.
Can I redistribute the template? It's for personal and professional use, but not for resale or broad distribution.