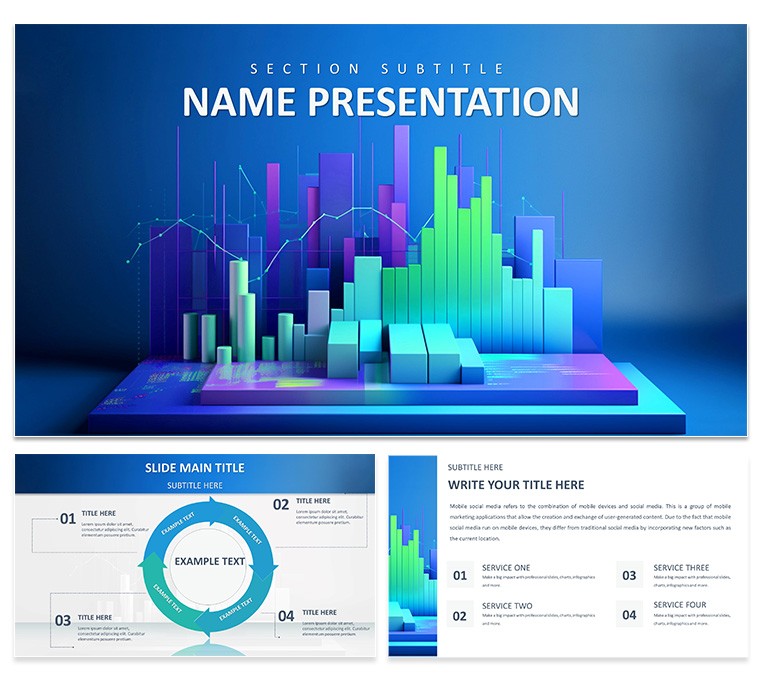
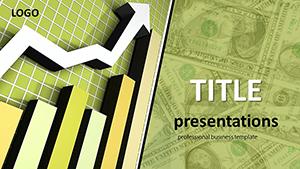
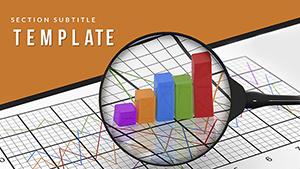
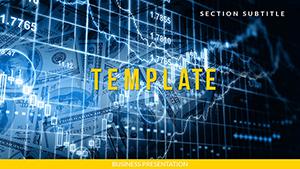
Numbers don't lie, but they do need a compelling voice to be heard. Enter our Business Graph PowerPoint Template, a powerhouse for executives who wield data as their greatest asset. Packed with 28 specialized diagrams spanning three masters and backgrounds, this template turns spreadsheets into stories that sway boardrooms. Tailored for finance whizzes, analysts, and managers tackling everything from quarterly earnings to market forecasts, its clean, modern design ensures your visuals lead without stealing the spotlight.
The beauty? Unrivaled adaptability in a sleek package. Seven color schemes - think earthy neutrals for conservative reports or bold accents for growth pitches - let you harmonize with corporate guidelines. Optimized for PowerPoint 2016 and beyond, with Google Slides compatibility, it's your go-to for seamless prep. Visualize a sales lead reviewing Q2 projections: they drop revenue figures into a line graph slide, and it auto-scales, weaving trends into a trajectory that forecasts triumphs. That's the shift from data dumps to decision drivers.
Mastering Data Narratives with Precision
At heart, this template is about elevation. Anchor your deck with master slides that incorporate subtle headers or footers for consistency. The three backgrounds vary from minimalist solids to faint grid patterns, framing graphs without distraction. Explore the 28 diagrams: bar stacks for budget breakdowns, scatter plots for correlation hunts, or area charts for cumulative impacts - each primed for your metrics.
An investment banker adapted the waterfall diagram for cash flow analysis, layering inflows and outflows to pinpoint variances. Her pitch landed funding because the visuals clarified complexities. Mirror that: edit via intuitive handles, preserving proportions as you iterate.
Essential Graphs for Business Brilliance
- Line Graphs for Trends: Track sales over seasons, with multi-series options for comparisons.
- Bar Charts Enhanced: Horizontal variants for long labels, like department expenses.
- Pie with Donut Alternatives: Show market shares, with inner rings for sub-categories.
- Combo Charts: Blend lines and bars for hybrid views, like revenue vs. costs.
High-res vectors mean no blur on big screens, and phased animations reveal layers, building suspense in forecasts.
Customizing for Crystal-Clear Insights
Editing flows naturally - link to external data sources for live updates, or manually tweak for static needs. For marketing teams, the icon library adds context, like upward arrows on growth curves. Tip: Opt for high-contrast schemes in dim venues to keep axes legible from afar.
Versus basic tools, where graphs fight for space, this template's balanced layouts let data breathe. A CFO used the heat map for regional performance, color-coding risks to guide expansions - transformative clarity in seconds.
From Raw Data to Ready Deck: A Guide
- Choose Foundation: Select a background suiting your report's gravity - grid for analytical depth.
- Load Your Figures: Paste into placeholders; axes recalibrate instantly.
- Palette Play: Cycle schemes to match fiscal themes, like greens for profits.
- Icon Infuse: Drag symbols to annotate peaks or dips meaningfully.
- Sequence Smartly: Arrange for logical progression, from overview to deep dives.
This streamlines hybrid workflows, syncing edits across cloud shares for team-aligned reports.
Driving Decisions with Visual Finesse
This template isn't just functional - it's a catalyst for confidence. In analyst trainings, it demystifies visualizations; for execs, it sharpens stakeholder buy-in. The professional undertones, akin to Fortune 500 decks, position you as the insight authority.
Empower your next review with visuals that command attention. Get the Business Graph PowerPoint Template for $22 and let your data do the talking.
Frequently Asked Questions
How many graph types are there?
28 diverse diagrams, from lines to combos, all geared toward business data.
Software support?
PowerPoint 2016+, Google Slides - edit anywhere, present everywhere.
Color customization level?
Seven schemes plus manual tweaks for total control over your look.
Best for which roles?
Finance, sales, and ops pros who need quick, impactful data stories.
Animation capabilities?
Yes, sequence builds to pace your reveals perfectly.