 Click to zoom
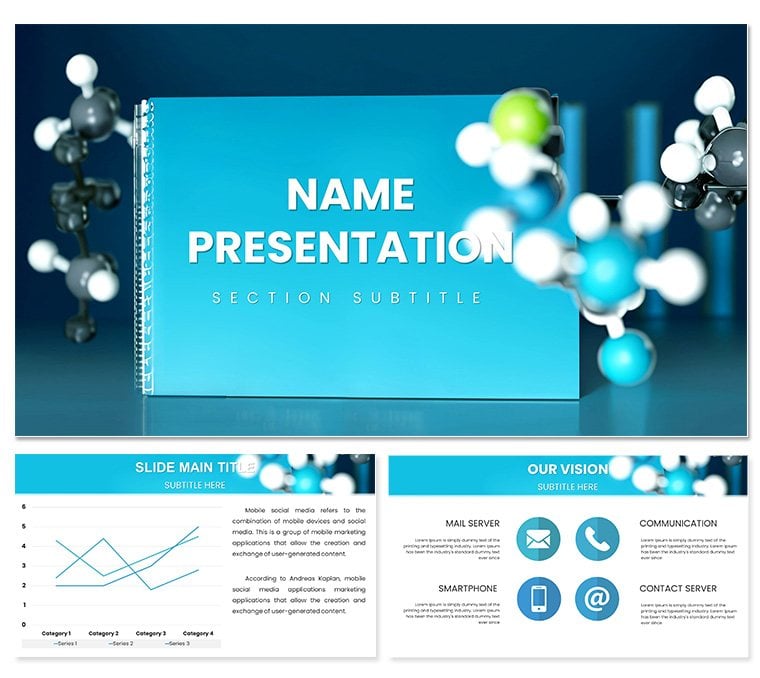
Chemical Biomedical Engineering PPT Slides
| Format | .pptx |
| Slides | 3 unique layouts |
| Aspect ratio | 16:9 |
| Compatibility | PowerPoint |
| Animated | No |
| Language | English |
| License | Commercial |
| File size | — |
| Version | v1.0 |
| Last updated | November 2024 |
What's inside
Conceive reactors humming with engineered harmony, where your slides channel that same orchestrated flow. The Presentation Chemical and Biomedical Engineering PowerPoint template arms engineers, grad students, and profs with 28 precise diagrams to convey fluid dynamics or tissue scaffolds with unerring accuracy. It's the go-to for piping process flows or biomaterial assays, turning technical tomes into streamlined symphonies for grant panels or classroom cadences.
Rooted in clean, functional aesthetics, it employs modular grids for data alignment, with icons evoking pipettes to bioreactors. Three masters forge cohesion, three backgrounds - from sterile whites to process blues - evoke lab rigor. Seven color schemes calibrate contrasts, ideal for pH gradients or stress-strain curves.
Precision Features for Engineering Excellence
Customization is engineered in: Tweak the heat exchanger diagram (slide 6) to model transfer rates, or stack Sankey flows for mass balances. The 28 diagrams are robust, ready for equation overlays or simulation snapshots.
- Technical Depth: From P&ID symbols to pharmacokinetic models, faithfully rendered.
- Analytical Arsenal: Charts for kinetics, tables for specs, hyperlinked.
- Robust Runtime: Optimized for PowerPoint 2016+, handler-free.
Page 25's bioreactor profile, for one, permits valve toggles, simulating fed-batch regimes interactively.
Process-Oriented Editing Routines
Commence with master infusions for dept crests, then channel protocols through sequence visuals. Opt a scheme for analyte highlights - sharps for peaks, fades for baselines. Sage integration: Link to MATLAB outputs, graphing live regressions on slides.
Engineering Engagements in Lab and Lecture
For a design review, utilize the project timeline to milestone milestones, bioreactor icons pulsing progress. Lecturers in biomed courses refit the diffusion equation slide for demos, solvating variables for Fick's law illuminations.
In patent filings, the innovation matrix arrays novelties, editable for claim mappings. Script a seminar:
- Inaugurate with a systems overview, funneling objectives.
- Detail designs in schematic cascades.
- Present data via contour plots.
- Envision applications, engineering horizons.
Outperforming Prototype Presentations
Vanilla variants vaporize variance; this sustains stoichiometry - vectors vector victory, masters mass-produce. Engineers esteem background bashes for iteration infusions, channeling creativity conservatively.
Mesh with Aspen simulations for authenticity, or describe alts - "Distillation column diagram with reflux ratios" - for archival access. Refinement: Contour shading on equipotentials for flux feels.
Bespoke Biomedical and Chemical Contexts
Prosthetics pioneers could calibrate the scaffold porosity (diagram 3) for cell adhesion assays, poring metrics. In pharma processes, the crystallization slide sieves polymorphs, sifting for stability.
Environmental engineers employ the remediation flow for contaminant tracks, flowing fixes. Each engineering echoes the template's tensile tenacity.
For transatlantic teams, schematic universality unifies, elastic elements expand. It's your manifold: pressurized, pivotal, paradigm-pushing.
Tuning for Technical Triumph
Synchronize surges to steady states - evolve equilibria as analyses advance. Distribute .pptx for design divers, distilling directives. Versus vacuum starts, it's a valve: valving valor.
Prototype your prowess - procure this template and propel paradigms presently.
Frequently Asked Questions
Are diagrams suitable for process flow modeling?
Yes, with symbols and arrows for PFD and P&ID accuracy.
Can color schemes represent engineering data types?
Certainly, seven options for gradients like temperature or concentration.
Does it support equation insertions?
Indeed, with math placeholders for LaTeX-like renders.
Is biomedical-specific content included?
Yes, slides for tissue engineering and drug delivery systems.
Good for
- Project roadmaps and sprint plans
- Product launch timelines
- Quarterly or annual review decks
- Company history and milestone summaries
Licence
reviews
The wifi signal strength diagram for connectivity is familiar.
The signal arcs were not perfectly circular. Adjusted them.
My network report used this. The audience understood instantly.
I think the template could use more than 4 bars. But fine.
Simple and universal. The download was fast.
FAQ
Will it work in Google Slides?
Are fonts embedded?
Can I use this for client work?
What's the refund policy?
Do you update the template after purchase?
Similar templates
See all PowerPoint Templates →


All 1 slides