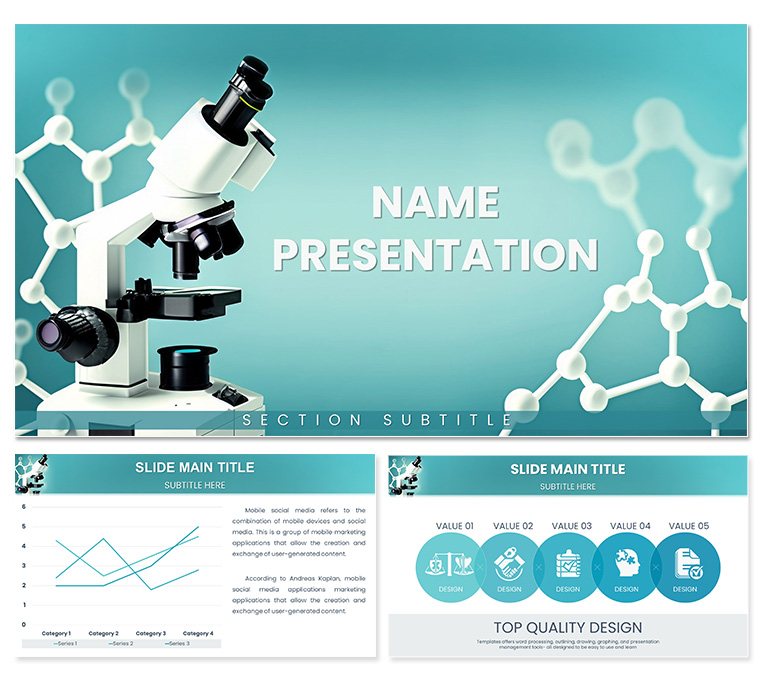
Imagine distilling intricate reaction pathways and molecular structures into slides that captivate your audience, whether it's a lab team huddle or a conference panel. This Chemical and Biochemical Engineering PowerPoint Template steps in as your visual ally, packed with 28 meticulously crafted diagrams ready to illustrate everything from fermentation flows to enzyme kinetics. Tailored for researchers, professors, and industry pros navigating the nuances of biochemical processes, it turns dense data into digestible narratives that stick. With seamless compatibility across PowerPoint 2016 and later versions, plus Google Slides support, you're set to adapt these elements to your workflow without a hitch.
What sets this template apart is its focus on precision - each diagram isn't just pretty; it's built to handle the specifics of your field, like plotting distillation columns or mapping metabolic pathways. You'll spend less time wrestling with shapes and more on refining your insights, freeing up mental bandwidth for the real breakthroughs. Picture a young biochemist presenting her thesis: instead of static bullet points, she unveils animated process flows that draw nods from the committee. That's the power here - bridging the gap between lab notes and boardroom buys.
Unlocking the Core Features of Your Engineering Slides
Dive into the toolkit: three master slides provide a consistent backbone, while three background options let you match your institution's palette or a client's branding. The star is the 28 diagrams, each with seven color schemes to tweak for accessibility or emphasis - think vibrant blues for fluid dynamics versus earthy tones for organic compounds. Every element is fully editable, from resizing vector icons of beakers and bonds to swapping data in embedded charts. No more pixelated clipart; these are scalable graphics that hold up under scrutiny.
- Infographic Mastery: Flowcharts for reaction sequences, pie charts for yield distributions, and timelines for project milestones - all pre-formatted to plug in your variables.
- Customization Ease: Drag-and-drop icons representing catalysts, reactors, and spectrometers, ensuring your visuals align with real-world schematics.
- Versatile Layouts: Mix and match for hybrid presentations, like combining a Sankey diagram for energy balances with a bar graph for cost analyses.
Pro tip: Start by selecting a master slide that echoes your slide's theme - perhaps a subtle grid overlay for data-heavy sections. Then, layer in your equations using the built-in equation editor integration, keeping everything mathematically crisp.
Real-World Applications: From Lab to Lecture Hall
In the fast-paced world of chemical engineering, clarity isn't optional - it's essential. Use this template to blueprint a proposal for sustainable biofuel production: Slide one kicks off with an overview infographic tracing feedstock to fuel, followed by editable Gantt charts for R&D timelines. A department head might leverage the process maps to train new hires, animating steps from mixing to purification so concepts click faster than a dry handout ever could.
For biochemical angles, envision mapping protein folding pathways - the template's layered diagrams let you peel back complexity, revealing interactions layer by layer. Consultants pitching to pharma giants could swap in proprietary data, using radar charts to compare inhibitor efficacies across trials. It's not about flashy effects; it's about fortifying your arguments with visuals that resonate, much like how leading firms streamline their annual reports for investor clarity.
Step-by-Step: Crafting a Process Flow Presentation
- Gather Your Data: Compile key metrics, like reaction rates or purity levels, into a simple spreadsheet.
- Select and Adapt: Pull a flowchart from the 28 options; resize nodes to fit your sequence and recolor arrows for directional flow.
- Integrate Narratives: Add concise annotations - e.g., "pH adjustment here boosts yield by optimizing enzyme activity" - right on the slide.
- Test and Refine: Run through presenter view to ensure animations reveal steps progressively, mimicking a live demo.
- Export and Share: Save as PDF for handouts or embed in reports, maintaining vector quality across formats.
This approach not only saves hours but ensures your audience follows the logic, turning skeptics into collaborators.
Why This Template Fits Your Workflow Seamlessly
Beyond the basics, it's the thoughtful touches that shine: HD vector elements mean no quality drop on large screens, and the seven schemes include high-contrast options for diverse viewing needs. Compatible with team collaboration tools, you can co-edit in real-time, ideal for cross-disciplinary projects blending chemistry and engineering. Compared to starting from scratch in PowerPoint, this shaves setup time dramatically, letting you iterate on ideas rather than interfaces.
Consider a scenario in academia: A professor preps for a grant review, using the template's cycle diagrams to loop in feedback mechanisms for bioreactor designs. The result? A deck that not only informs but inspires, echoing the structured elegance of peer-reviewed visuals. Or in industry, visualize a safety audit presentation - hazard matrices and risk assessments rendered with intuitive icons, making compliance feel approachable.
Enhancing Engagement with Themed Elements
The icon library draws from authentic lab motifs - think helical DNA strands or orbital models - ensuring relevance without generic placeholders. Pair these with subtle transitions, like fade-ins for sequential reactions, to guide eyes naturally. For deeper dives, hyperlink diagram hotspots to appendix slides, creating an interactive layer that rewards curious viewers.
Customization extends to fonts too; opt for sans-serif staples like Calibri for readability, or serif accents for formal reports. It's all about balance - professional yet approachable, precise yet persuasive.
Getting Started: Tips for Maximum Impact
To hit the ground running, preview the diagrams in thumbnail view first, noting which align with your outline. Import your dataset via Excel links for live updates, keeping numbers fresh without manual tweaks. For biochemical storytelling, sequence slides chronologically: intro the hypothesis, visualize methods, chart results, and close with implications. This linear flow mirrors scientific method, building momentum organically.
If you're blending fields, like environmental engineering tie-ins, the flexible layouts accommodate hybrid visuals - e.g., overlaying pollution dispersion models on metabolic charts. And for remote delivery, the template's lightweight files ensure smooth Zoom shares, no lag in sight.
Ready to catalyze your next presentation? Grab this template for $22 and watch your ideas react with the audience.
Frequently Asked Questions
How editable are the diagrams in this Chemical Engineering template?
All 28 diagrams are fully vector-based, allowing you to resize, recolor, and rearrange elements without losing quality. Simply select and modify in PowerPoint's drawing tools.
Does it work with Google Slides for team collaboration?
Yes, the .pptx format imports seamlessly into Google Slides, preserving layouts and enabling real-time edits with your collaborators.
Are there animations included for process flows?
Basic entrance animations are pre-set on key elements like arrows and nodes; customize further via PowerPoint's animation pane for tailored reveals.
Can I use this for commercial engineering reports?
Absolutely - it's licensed for professional use, including client pitches and published materials, as long as you adhere to standard attribution if required.
What if I need more than the 28 diagrams?
The masters allow easy duplication and adaptation; combine elements across slides to build custom visuals beyond the included set.