 Click to zoom
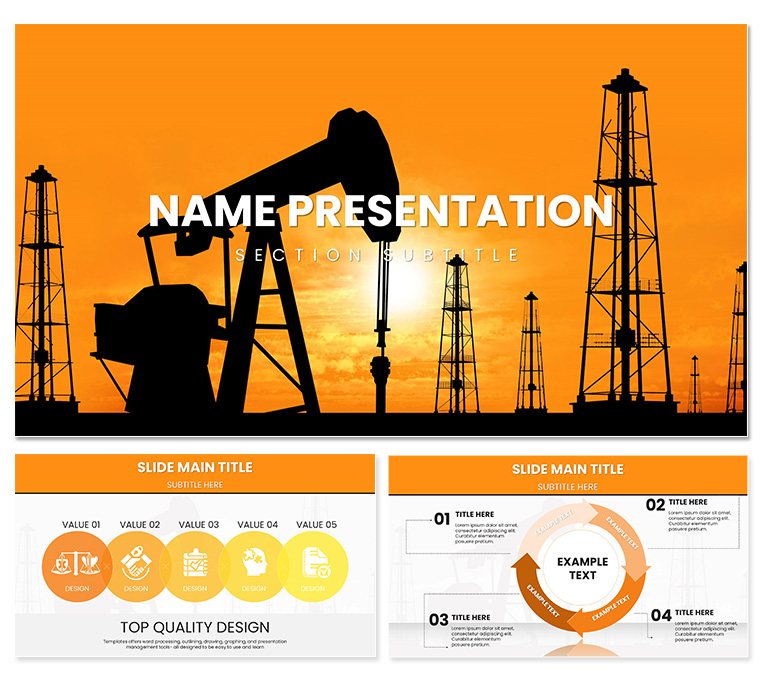
Oil & Gas Extraction PowerPoint Template: Fuel Your Industry Insights
| Format | .pptx |
| Slides | 3 unique layouts |
| Aspect ratio | 16:9 |
| Compatibility | PowerPoint |
| Animated | No |
| Language | English |
| License | Commercial |
| File size | — |
| Version | v1.0 |
| Last updated | April 2023 |
What's inside
In the high-pressure world of energy consulting, where every chart must extract maximum value from complex data, the Oil & Gas Extraction PowerPoint Template emerges as your reliable rig. Tailored for analysts, business owners, and consultants dissecting upstream operations, this template transforms spreadsheets into strategic masterpieces that uncover opportunities and mitigate risks with striking clarity.
Equipped with 28 diagrams, three masters, three backgrounds, and seven color schemes, it offers the robustness to handle everything from reserve estimations to pipeline logistics. Forget piecing together mismatched slides; this cohesive design, infused with industry motifs like derrick silhouettes and flow diagrams, lets you convey extraction efficiencies or market volatilities in a way that captivates executives and stakeholders alike. For only $22, unlock a toolkit that powers your presentations from exploration to export.
Essential Features That Drive Results
At its core, this template prioritizes usability without sacrificing sophistication. Every diagram is vector-based and fully editable in PowerPoint, meaning you can resize seismic maps or adjust bar graphs for production forecasts without pixelation or hassle. The three masters ensure consistent branding across sections, while the backgrounds - subtle gradients evoking oil fields - add depth without distraction.
- Diagram Variety: From scatter plots for well performance to Sankey diagrams tracing resource flows, 28 options cover the spectrum of oil and gas analytics.
- Color Flexibility: Seven schemes, including earthy tones for sustainability reports or bold contrasts for urgent alerts, adapt to your narrative's tone.
- Built-in Tools: Pre-formatted placeholders for data import make it simple to link Excel sheets, automating updates for live demos.
These aren't arbitrary additions; they're engineered to address common pain points, like visualizing layered subsurface data, allowing you to layer interpretations over geological scans effortlessly.
Effortless Customization in PowerPoint
Launch the .pptx file and you're greeted with an intuitive layout: Select a master, drop in your metrics, and watch the slide adapt. PowerPoint 2016 and newer handle the animations seamlessly, such as phased builds for drilling sequences that reveal stages progressively. A quick tip: Use the alignment tools to snap icons - like pump jacks or valves - to grid lines, ensuring professional polish every time.
Targeted Use Cases in the Energy Sector
Envision a consultant prepping a client pitch on shale gas viability; the template's funnel charts can illustrate extraction yields, funneling viewer focus from raw inputs to refined outputs. Or for a business owner reviewing quarterly yields, the dashboard-style slides aggregate KPIs into at-a-glance panels, spotlighting variances that demand action.
In regulatory filings, where transparency is key, leverage the timeline layouts to chronicle project milestones, from permitting to production, aligning with compliance narratives. These applications extend beyond corporates - academics in petroleum engineering use them to simulate extraction models, making abstract concepts tangible for students.
Step-by-Step: Crafting a Reserve Report
- Set the Stage: Begin with an overview slide, embedding your company logo into the master for instant recognition.
- Layer the Data: Insert borehole logs into line graph templates, color-coding by depth for intuitive reading.
- Forecast Flows: Build a process map slide to trace crude from wellhead to refinery, annotating bottlenecks with callouts.
- Quantify Risks: Employ risk matrices to plot volatility factors, using conditional formatting for high-impact zones.
- Seal the Deal: Conclude with a summary infographic, pulling key metrics into a balanced scorecard for executive takeaways.
This methodical build not only organizes your content but amplifies its persuasive edge, turning data dumps into decisive dialogues.
Standing Out Against Standard PowerPoint Options
While PowerPoint's built-ins suffice for basics, they falter in niche domains like oil and gas, where contextual visuals matter. This template counters that with thematic elements - refinery icons and pressure gauge motifs - that resonate with industry pros, fostering trust through familiarity. The result? Decks that don't just display numbers but narrate the story of extraction's challenges and triumphs.
Compared to ad-hoc designs, it cuts prep time by providing ready scaffolds, letting you iterate on insights rather than aesthetics. Integrate with PowerPoint's chart tools for real-time tweaks, and your reports gain the agility needed for fast-evolving markets.
Pro Tips for Energy Pros
- Embed hyperlinks in flow arrows to jump to detailed appendices, enhancing interactivity in virtual reviews.
- Opt for monochromatic schemes in formal audits to emphasize data over flair.
- Combine with 3D rotation effects on cylindrical tank visuals for immersive scale demonstrations.
Grab the Oil & Gas Extraction PowerPoint Template now for $22 and refine your presentations into pure, unadulterated value.
Frequently Asked Questions
What versions of PowerPoint does this template support?
It's fully compatible with PowerPoint 2016 and later, including Microsoft 365 editions.
Are the diagrams resizable without quality loss?
Yes, all elements are vector-based, ensuring crisp scaling across any slide size.
Can I add my own images to the backgrounds?
Absolutely, the layered structure allows easy replacement or overlay of custom visuals like site photos.
Is it limited to oil and gas topics?
No, the adaptable diagrams suit any data-driven presentation in energy or related fields.
How do I change color schemes?
Access via the master view and apply globally with one click for instant updates.
Does it include sample data?
Placeholders come with demo figures, ready for your real metrics.
Good for
- Project roadmaps and sprint plans
- Product launch timelines
- Quarterly or annual review decks
- Company history and milestone summaries
Licence
reviews
The calendar with marked dates for deadlines or events is practical.
The date numbers were too small. Enlarged them.
My project timeline used this. The milestone stars were helpful.
I think the template needed a way to highlight weeks. Added boxes.
Simple and useful. The download was fast.
FAQ
Will it work in Google Slides?
Are fonts embedded?
Can I use this for client work?
What's the refund policy?
Do you update the template after purchase?
Similar templates
See all PowerPoint Templates →


All 1 slides