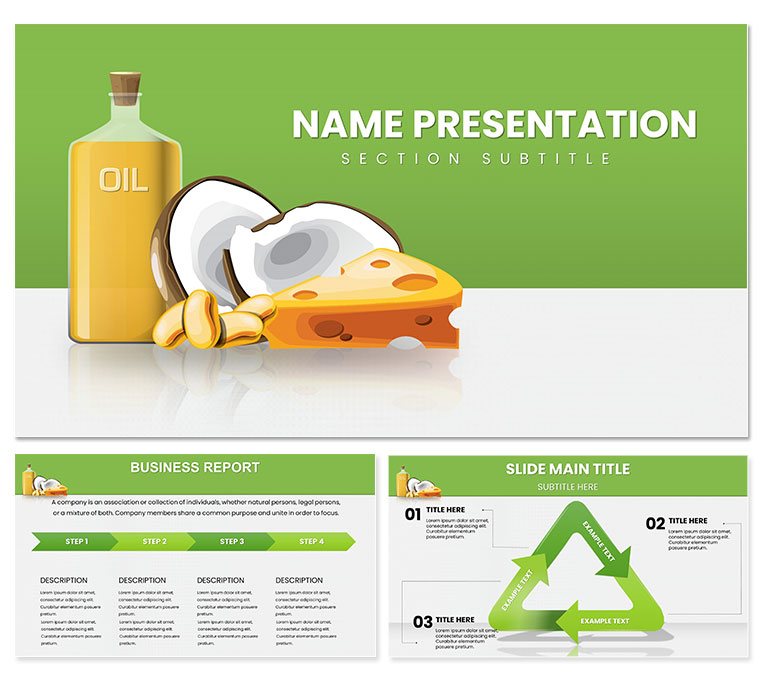
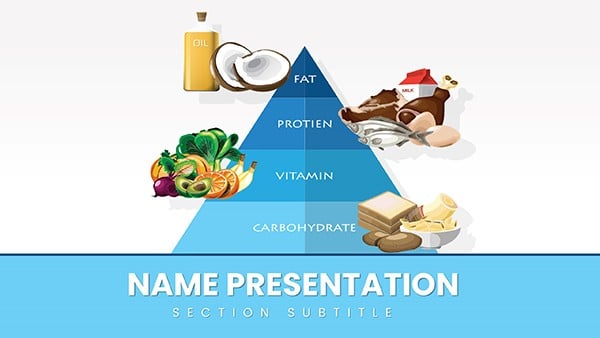
Imagine stepping into a boardroom or seminar hall where your slides don't just inform but inspire a deeper appreciation for the role of fats and oils in daily diets. That's the power this PowerPoint template unlocks for you. Designed specifically for professionals in the food and beverage sector, this template transforms complex topics like lipid profiles, cooking essentials, and sustainable sourcing into visually engaging stories. With 28 meticulously crafted diagrams, three versatile masters, and three background options, you'll have a ready-to-use foundation that respects both your product's integrity and your company's brand voice.
Whether you're a nutritionist outlining balanced meal plans or a food manufacturer pitching new oil blends, this template cuts through the clutter of generic slides. It offers seven color schemes to match your palette - think warm earth tones for olive oils or vibrant greens for seed extracts - ensuring every presentation feels fresh and targeted. Compatible with PowerPoint 2016 and later versions, it's built on user-tested layouts that prioritize clarity and flow, much like the structured approaches seen in industry reports from organizations focused on dietary guidelines.
At its core, this template solves the common frustration of starting from scratch: hours spent aligning icons and charts that never quite fit. Instead, dive into editable elements that let you swap data effortlessly, from pie charts breaking down fatty acid compositions to timelines tracing oil production processes. It's not just about looking good; it's about communicating value - helping your audience grasp why certain fats fuel better health outcomes or enhance flavor profiles without overwhelming them with text-heavy slides.
Unlocking Key Features for Seamless Customization
Let's break down what makes this template a standout tool in your presentation arsenal. The three masters provide a consistent framework: one for title slides that set a welcoming tone with subtle droplet motifs evoking oil essence, another for content-heavy pages optimized for bullet points and visuals, and a third for closing summaries that leave a memorable impact. Pair these with the three backgrounds - minimalist white for clean data displays, textured parchment for a artisanal feel, or a soft gradient for modern appeal - and you've got flexibility that adapts to any venue, from virtual webinars to in-person trade shows.
The real magic lies in the 28 diagrams, each engineered for specific storytelling needs. For instance, there's a radial chart perfect for illustrating omega-3 distributions across food sources, fully vector-based so you can resize without losing quality. Or consider the process flow diagram that maps out refining stages for vegetable oils, complete with customizable arrows and icons like beakers and leaves. These aren't static images; they're interactive canvases where you drag, drop, and tweak to fit your narrative. And with seven color schemes, you can align everything to your brand - perhaps a monochromatic blue for corporate health initiatives or multicolored accents for consumer-facing recipe demos.
- Vector Graphics: All elements scale perfectly, maintaining sharpness on any screen size.
- Theme Icons: Over 50 built-in symbols, from molecular chains to harvest motifs, ready to enhance your points.
- Layered Structure: Easy access to individual components for precise edits, no design software required.
Real-World Applications: From Pitch to Plate
Picture a food technologist at a sustainability conference. Using this template, they layer in data on eco-friendly palm oil alternatives via a stacked bar graph, then transition to a before-and-after infographic showing reduced trans fats in reformulated products. The result? An audience hooked, questions flowing, and partnerships sparked - all because the slides amplified the message without distracting from it.
In another scenario, a dietitian preparing a workshop on Mediterranean diets pulls from the template's comparison tables to juxtapose saturated versus unsaturated fats, complete with photo placeholders for real dish visuals. This isn't hypothetical; it's how professionals turn dense research into digestible insights, fostering trust and encouraging actionable takeaways like recipe swaps or supplier shifts.
Step-by-Step: Building Your First Nutrition Deck
- Select Your Master: Choose the content master and apply a background that echoes your theme - say, a subtle olive branch pattern for heart-healthy talks.
- Insert Diagrams: Drag in the cycle diagram for metabolic pathways, then input your data points via simple text fields.
- Customize Colors: Switch to Scheme 4 for a vibrant pop, ensuring accessibility with high-contrast text overlays.
- Add Personal Touches: Upload branded images into placeholders, then animate transitions for a smooth reveal of key stats.
- Review and Export: Test on different devices, then save as PPTX for sharing or PDF for handouts.
This workflow integrates seamlessly with your existing tools, whether you're pulling data from Excel for cholesterol impact charts or sourcing images from stock libraries focused on culinary arts.
Why This Template Outshines Basic Builds
Compared to vanilla PowerPoint setups, where you're wrestling with misaligned shapes and bland defaults, this template hands you pre-vetted designs that save mental energy for content refinement. No more pixel-hunting for the perfect oil drop icon; it's all there, refined through iterations that echo best practices from presentation experts like those crafting decks for global food expos. The benefits ripple out: shorter prep times mean more focus on rehearsal, leading to confident deliveries that resonate longer.
For teams collaborating on product launches, the layered files mean one designer handles visuals while analysts update figures - streamlining reviews without version chaos. And for solo creators, the intuitive drag-and-drop means you can prototype a full deck in under an hour, iterating based on feedback loops that keep your message sharp.
Tips for Maximum Impact in Food-Focused Talks
- Pair diagrams with real anecdotes, like how avocado oils shine in high-heat cooking, to bridge data and daily life.
- Use animations sparingly - fade-ins on fat molecule breakdowns keep eyes on the science, not the effects.
- Test color schemes under various lighting; the seven options ensure visibility from dim seminar rooms to bright kitchens.
Download this Fats & Oils PowerPoint template for $22 today and watch your presentations nourish both minds and discussions.
Frequently Asked Questions
What formats does the template come in?
It includes .PPTX for direct editing in PowerPoint, .POTX for theme application, and .JPG previews for quick references.
How many diagrams are included, and are they editable?
There are 28 fully editable diagrams, from charts to infographics, allowing complete customization of shapes, colors, and data.
Is this template compatible with older PowerPoint versions?
Yes, it works with PowerPoint 2016 and newer, ensuring broad accessibility for most users.
Can I use this for non-food presentations?
While optimized for nutrition topics, the versatile designs adapt well to related areas like chemistry or wellness.
Does it include icons or stock images?
It features over 50 theme-specific icons; placeholders are ready for your own images to maintain originality.