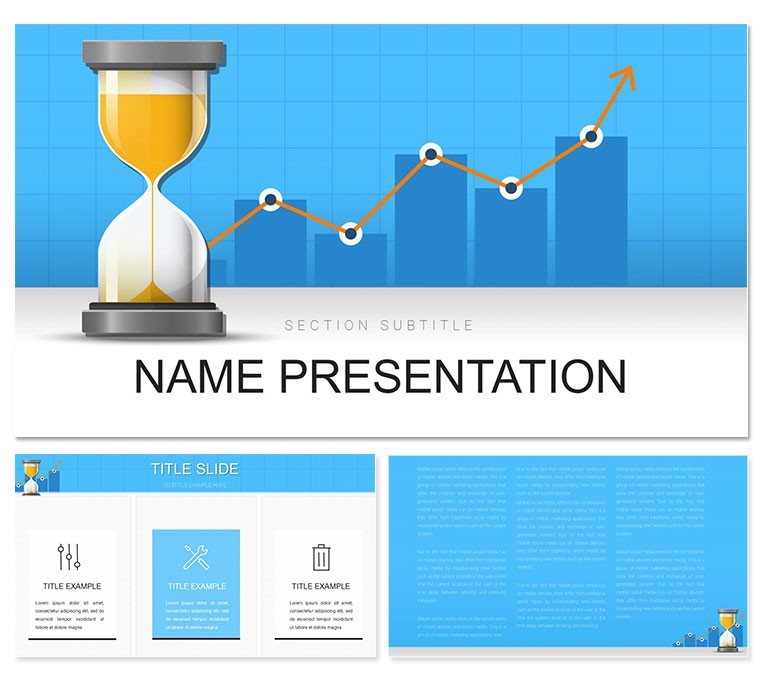
Navigating the ebb and flow of markets demands not just sharp analysis but visuals that capture the moment's promise. The Perfect Time to Invest PowerPoint Template equips finance pros, advisors, and analysts with 28 precision-engineered diagrams, three master slides, and three evocative backgrounds to frame opportunities that resonate. Compatible with PowerPoint 2016 and beyond, this deck turns number-crunching into narrative gold, helping you guide clients toward decisions that pay off.
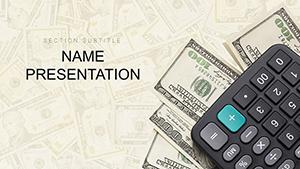
With seven color schemes - from bullish greens to cautious neutrals - this template adapts to your fiscal storytelling, whether highlighting currency trends or trade forecasts. It's crafted for those high-value moments, like quarterly reviews where a single slide can sway portfolio shifts.
Think of a wealth manager prepping for a client summit: The opening investment timeline diagram charts historical peaks, seamlessly leading into opportunity radars that pinpoint 'now' as the sweet spot. This mirrors approaches in reports from firms like Vanguard, where clarity accelerates trust and action.
Key Features Fueling Financial Narratives
Built for impact, the template's masters cover overview canvases, data-deep dives, and summary closers, all editable in familiar PowerPoint tools.
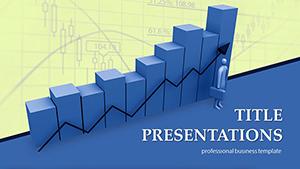
- 28 Finance-Tuned Diagrams: Line graphs for market trajectories, pie charts for asset allocations, each with smart art placeholders.
- Seven Palette Variations: Shift from warm investment hues to cool risk assessments, aligning with your report's tone.
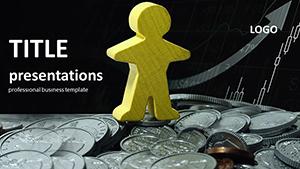
- Scalable Charts and Symbols: Currency icons and trend arrows that maintain crispness when zoomed or printed.
These aren't off-the-shelf; they're tailored for monetary discussions, letting you overlay real data from Excel without reformatting hassles.
Use Cases That Capitalize on Timing
For trade analysts, it's a staple in currency fluctuation decks - use radial models to compare global rates, then funnel into recommendation funnels. In advisory roles, layer in client-specific scenarios via customizable bars, making abstract returns tangible.
Educators in finance courses appreciate the sequential builds for teaching investment cycles. A simple integration flow:
- Launch and Align: Open the .pptx, select a master, and theme colors to your institution's palette.
- Infuse Data: Drop in metrics like ROI projections into timeline slots for dynamic growth visuals.
- Polish and Share: Animate rises for emphasis, then save as .potx for team templates.
Versus vanilla PowerPoint shapes, this delivers pre-aligned layouts that save iterations, focusing your energy on insights over aesthetics.
Pro Tips for Investment Deck Mastery
Enhance with conditional formatting - link chart colors to thresholds for instant risk highlights. For a trader's market update, incorporate live feeds via linked tables, updating slides on the fly.
One advisor tweaked the opportunity matrix for crypto pitches, adding node hyperlinks to whitepapers, which streamlined follow-ups. Keep paras short in notes for seamless narration.
The .jpg previews aid quick mocks, ensuring your final deck hits every mark.
What Makes This Template a Fiscal Favorite
It bridges data and persuasion with specialized visuals for trade and systems, outpacing generic options in relevance and readiness.
Seize the moment - download the Perfect Time to Invest PowerPoint Template for $22 and invest in slides that yield returns.
Frequently Asked Questions
Compatible with all PowerPoint editions?
Yes, from 2016 onward, including Microsoft 365 integrations.
Can I add live data links?
Absolutely - embed Excel charts that refresh automatically for up-to-date visuals.
Best for client pitches?
Ideal, with diagrams that simplify complex trades into actionable stories.
Number of color options?
Seven schemes, customizable further for brand matching.
File types included?
.pptx for editing, .potx for themes, and JPGs for previews.