Step into a strategy session where numbers don't just add up - they illuminate opportunities, risks, and triumphs with the precision of a well-honed ledger. The Financial and Business Graphics PowerPoint Template is engineered for analysts, executives, and advisors who need to distill complex fiscal data into compelling visuals that sway stakeholders. Ideal for quarterly reviews, investment proposals, or departmental forecasts, this template turns spreadsheets into stories that drive action and alignment.
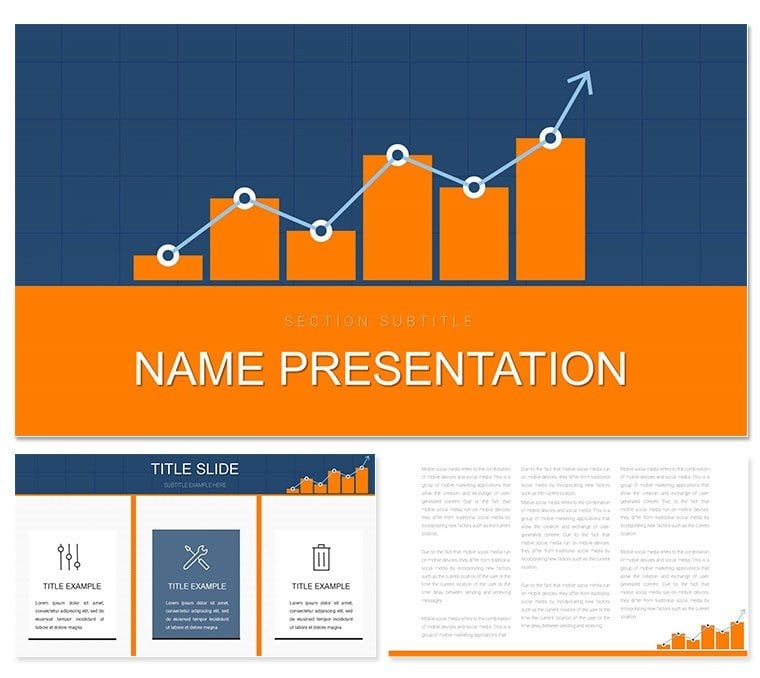
Anchored in financial analysis and business intelligence, it delivers 28 diagrams - from balance sheet breakdowns to trend forecasting lines - within a professional scaffold compatible with PowerPoint 2016 and beyond. Formats include .pptx for hands-on edits, .potx for reusable bases, and .jpg for mocks. Three masters enforce branding consistency, while three backgrounds range from stark whites for raw data to subtle gradients for executive summaries, all laced with currency symbols and growth arrows for thematic depth.
The real edge? It empowers users to layer narratives atop metrics, like overlaying market commentary on revenue pies, ensuring your deck doesn't just report but recommends. In a world of fleeting attention, these slides hold focus, making every pivot point pop.
Power-Packed Features for Fiscal Fluency
At the heart of this template are features that anticipate the demands of data-driven decisions. Seven color schemes, from conservative grays to optimistic greens, ensure versatility while upholding legibility in dim conference rooms or bright dashboards.
- 28 Specialized Diagrams: Bar charts for comparisons, scatterplots for correlations, and tables for granular audits - all pre-formatted for Excel imports and drag-resizes.
- Three Master Frameworks: Govern slide anatomy, from ledger-style titles to footnote-compliant closers, for audit-ready polish.
- Three Background Layers: Minimalist for charts, textured ledger for reports, or bold accents for key takeaways.
- Business Icon Library: 60+ assets like bull markets, pie slices, and arrow vectors to annotate without excess text.
These components forge a toolkit that's as robust as it is refined, ready to tackle any balance sheet battle.
Strategic Scenarios: From Boardroom to Break-Even
This template thrives in high-stakes finance arenas. A CFO unveiling annuals might deploy waterfall diagrams to trace profit cascades, pinpointing levers for cost control. Venture capitalists, eyeing pitches, favor the ROI radars that spotlight scalable metrics, framing startups as sure bets.
In internal audits, managers use heatmap tables to flag variances, guiding reallocations with visual urgency. Or for mergers, advisors layer SWOT matrices with financial overlays, merging narratives seamlessly. These deployments reveal the template's prowess in translating figures into foresight.
Blueprint for Bespoke Financial Decks
Refining your visuals is methodical, mirroring a balanced portfolio. Navigate thus:
- Initiate the Deck: Load .pptx, select a master, and embed your firm logo via Format Shape for instant identity.
- Infuse Intelligence: Paste data into pie charts, using Chart Tools to refine axes and legends for precision.
- Harmonize Hues: Cycle schemes in Variants, assessing against brand guidelines for cohesive appeal.
- Amplify with Assets: Drop in trend lines or callout bubbles, aligning with subtle fades for layered reveals.
- Validate Vision: Simulate in Presenter mode, exporting to PDF for stakeholder previews or animations for live demos.
This sequence streamlines from raw inputs to refined outputs, optimizing every session.
The Competitive Edge in Business Visuals
Where vanilla charts blur, this template sharpens, with responsive elements that scale from micro-trends to macro-strategies. It echoes best practices from pros like those in Harvard Business Review visuals, prioritizing clarity over clutter.
Think of a treasury analyst at a Fortune 500 who streamlined budget defenses with these infographics - the board's questions halved, approvals hastened. Or a boutique advisor crafting client recaps, where custom scatters unveiled hidden correlations, forging trust. These vignettes underscore its catalyst for clarity.
Integrate with Tableau exports for dynamic links, or sync with ERP pulls for live feeds. The payoff? Presentations that don't merely inform but invest in understanding.
Invest in Your Next Fiscal Narrative
Elevate from numbers to narratives with the Financial Graphics PowerPoint Template at $22. Download it now and plot a course to persuasive prowess.
Frequently Asked Questions
Are charts linked to external data?
Yes, most support Excel connections for real-time updates during edits.
What's the compatibility scope?
Fully functional in PowerPoint 2016+, with tips for older saves.
Can I customize for investor decks?
Indeed, with tailored layouts for pitches, including equity breakdowns.
How many icon variations?
Over 60, covering finance staples like ledgers and growth curves.
Does it handle large datasets?
Optimized for efficiency, with grouping tools to manage complexity.
Animation options included?
Basic builds for sequences; expand via PowerPoint's timeline for emphasis.