 Click to zoom
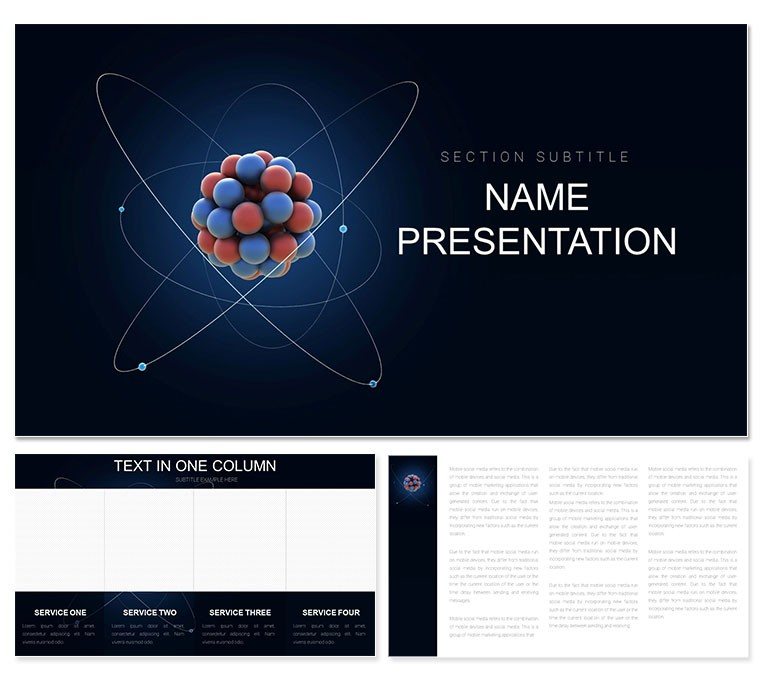
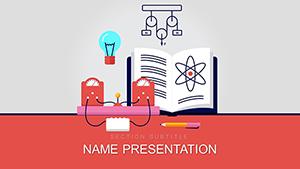
Atom Isotopes PowerPoint Template: Explore the Building Blocks
| Format | .pptx |
| Slides | 3 unique layouts |
| Aspect ratio | 16:9 |
| Compatibility | PowerPoint |
| Animated | No |
| Language | English |
| License | Commercial |
| File size | — |
| Version | v1.0 |
| Last updated | February 2023 |
What's inside
Unlock the microscopic mysteries that shape our universe, one slide at a time, with visuals that make the invisible irresistible. The Atom Isotopes PowerPoint Template is a boon for science instructors and researchers aiming to demystify protons, neutrons, and their isotopic kin in ways that ignite curiosity. From high school labs probing element stability to college seminars on radiometric dating, this template equips you to convey quantum complexities with elegance and ease.
Devoted to atoms and isotopes in chemistry and physics realms, it houses 28 diagrams - from electron cloud models to decay chains - streamlined for PowerPoint 2016+. Available as .pptx, .potx, and .jpg, it boasts three masters for scientific rigor and three backgrounds mimicking lab whites or cosmic blues. Nucleus icons and orbital paths thread the design, evoking the thrill of discovery without the clutter.
Its genius? Bridging theory and application, like illustrating medical tracers alongside structural sketches, so learners connect dots from desk to real-world wonders. In engaging formats, these slides spark "aha" moments that linger long after the bell.
Atomic Features: Precision in Every Particle
Like a well-calibrated spectrometer, the template's features deliver accuracy and adaptability. Seven color schemes, from metallic silvers to reactive reds, enhance visibility for projected demos or printed notes.
- 28 Scientific Diagrams: Bohr models, mass spectra, and application mindmaps - all scalable, with equation placeholders for formulas.
- Three Master Structures: Anchor hypotheses, methods, and conclusions, ensuring logical progression in experiments.
- Three Background Variants: Stark lab grid for data, starry void for theory, or periodic table motifs for context.
- Lab-Ready Icons: 50+ elements like quarks, bonds, and tracers to symbolize without simplifying unduly.
These assets assemble into a nucleus of knowledge, primed for probing presentations.
Laboratory Landscapes: Isotopes in Action
This template energizes diverse scientific soils. A physics prof charting carbon dating uses timeline decays to timeline human history, linking isotopes to archaeology. Biology tutors, tracing medical uses, overlay vein scans on distribution maps for targeted therapies.
In industry overviews, engineers depict fuel cycles with process loops, clarifying nuclear pros and cons. Or for environmental studies, analysts visualize pollution trackers via diffusion spreads. These vistas validate the template's versatility in vivifying vital concepts.
Orchestrating Your Atomic Deck: A Sequential Synthesis
Assembling is elemental, akin to bonding atoms. Proceed as follows:
- Nucleate the Base: Initiate .pptx, customize master with lab headers, embedding symbols like sigma for stats.
- Infuse Isotopes: Populate orbital diagrams with particle counts, leveraging smart connectors for bonds.
- Spectrum Shift: Apply schemes from Design, tuning to wavelength themes for spectral flair.
- Orbit Extras: Add phase animations or hyperlink to simulations, orbiting viewers around ideas.
- Fission Finalize: Debug in slideshow, archiving as PDF for journals or sharing via lab drives.
This fusion yields fission-free flows, every time.
Why This Template Resonates in Science Circles
Surpassing stock images with bespoke builds, it resonates like a tuned resonator, aligning with pedagogical paths from sources like the American Chemical Society. Scalable shells suit solo studies or seminar spectacles.
Consider a grad TA who revolutionized isotope lectures with these clouds - the class retention rocketed, questions deepened. Or a researcher pitching grants, where application webs wove funding narratives. These echoes affirm its catalytic core.
Mesh with PhET sims for interactivity, or align with lab logs for empirical ties. The essence? Slides that don't just show atoms but assemble understanding.
Split Seconds to Stellar Science Slides
Charge up your curriculum with the Atom Isotopes PowerPoint Template for $22. Download and catalyze classroom chemistry today.
Frequently Asked Questions
Are diagrams scientifically accurate?
Yes, based on standard models, with editable labels for custom notations.
PowerPoint version requirements?
2016+ for full features; test exports for legacy.
Can I include equations?
Absolutely, placeholders support MathType inserts or native equations.
Icon scalability?
All vector-based, resizing crisply for any slide scale.
Suitable for non-lab uses?
Yes, adapts to lectures, posters, or webinar overviews.
Animation for particle motion?
Includes paths for orbits; layer for decay simulations.
Good for
- Project roadmaps and sprint plans
- Product launch timelines
- Quarterly or annual review decks
- Company history and milestone summaries
Licence
reviews
Decent for a team competency review.
The colors are a bit bright but ok.
Saved me from creating from scratch.
Needed a radar chart for a skills assessment, the spiderweb is fine.
The axis labels are hard to read but i made them larger.
FAQ
Will it work in Google Slides?
Are fonts embedded?
Can I use this for client work?
What's the refund policy?
Do you update the template after purchase?
Similar templates
See all PowerPoint Templates →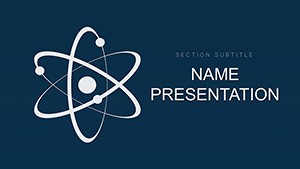
All 1 slides