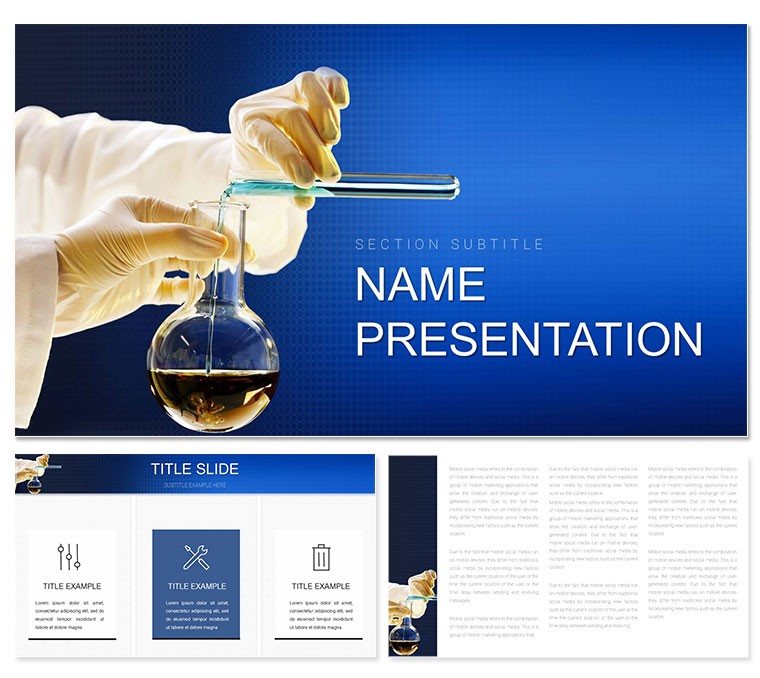
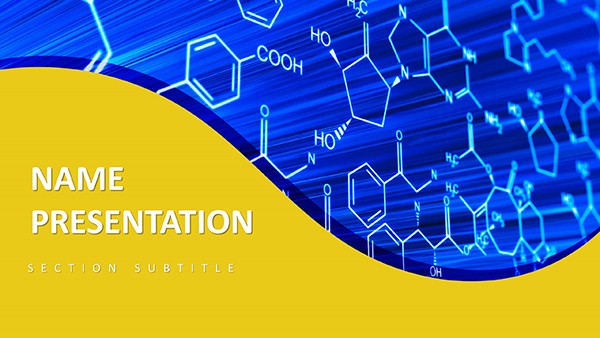
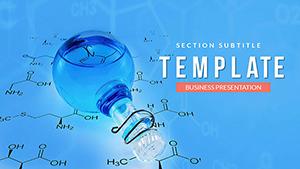
Envision a lab report where molecular bonds and reaction pathways unfold like a well-orchestrated experiment, captivating your audience from the first slide. The Chemical Reaction PowerPoint template is your catalyst for such transformations, tailored for chemists, biologists, lab technicians, and industry analysts who demand visuals as precise as their pipettes. This collection of 28 diagrams - ranging from equilibrium curves to enzyme kinetics models - empowers you to dissect complex processes without the clutter of makeshift charts. Built for PowerPoint 2016+, it features three masters for varied lab settings: sterile white for protocols, vibrant for educational demos, and industrial gray for process engineering. Swap in your spectral data, adjust reaction arrows, and let the animations simulate cascades, turning static slides into live demonstrations.
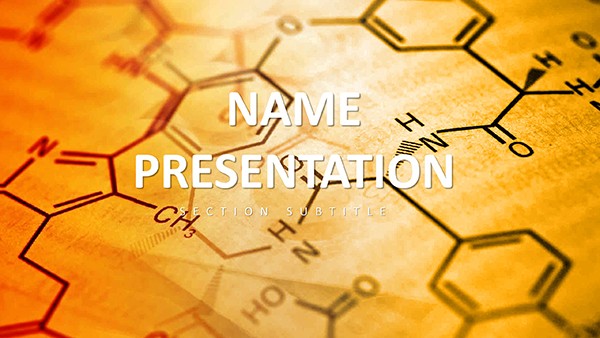
What sets this apart is its fidelity to scientific storytelling. A single slide might depict a titration curve with overlaid pH gradients, editable to reflect your latest trials. For biology educators, the cell division sequences use layered cycles that peel back stages, revealing mitosis in digestible layers. These aren't generic placeholders; they're rooted in standard notations, ensuring your peers recognize the rigor at a glance. In an era of virtual collaborations, the template's clean vectors scale flawlessly for Zoom shares or printed posters, bridging the gap between bench and boardroom.
Core Features: Elements That Bond with Your Workflow
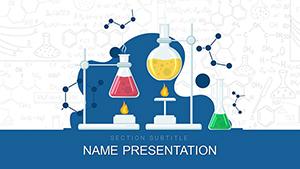
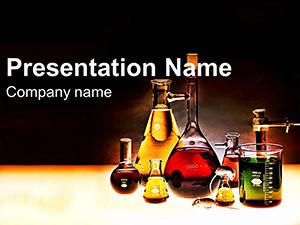
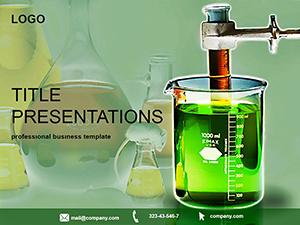
Explore the toolkit: 28 diagrams include periodic table infographics, reaction mechanism arrows, and biomass flowcharts, all with seven color schemes evoking lab hues - from cool blues for aqueous solutions to fiery reds for exothermic shifts. Backgrounds adapt to themes like organic synthesis or petrochemical flows, while masters lock in fonts like Arial for readability under fluorescent lights. Editing flows naturally: right-click a flask icon to recolor it, or use SmartArt tweaks for branching pathways in metabolic maps.
- Molecular Structure Builders: Assemble Lewis dots or 3D models with snap-to-grid precision, ideal for patent filings.
- Process Flowcharts: Trace synthesis steps with directional valves, animating to show yield progressions.
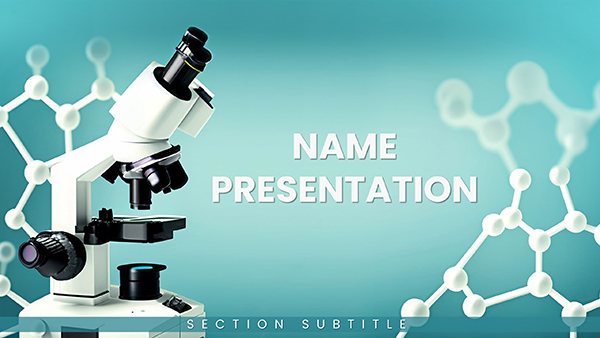
- Data Visualization Icons: Beakers and spectrometers that integrate with Excel imports for real-time lab metrics.
Think of how pharmaceutical teams, akin to those at Pfizer's R&D decks, rely on such clarity for grant proposals - this template delivers that polish without a design degree.
Applying Reactions: From Classroom to Conference
Picture a university lecture on thermodynamics: the instructor drops in a energy diagram from the template, customizing barriers to match student experiments, sparking questions that extend the session. In industry, a process engineer uses the batch reactor sequence to audit efficiencies, layering cost annotations to justify upgrades. For environmental reports, the pollution diffusion models map contaminant spreads, with isolines editable for site-specific data, making abstract impacts tangible.
Another scenario: a biotech startup pitching to VCs. The gene editing slide employs CRISPR visuals - double-helix icons with cut sites - that evolve via transitions, underscoring innovation without jargon overload. This approach not only informs but persuades, as the visuals mirror the precision of peer-reviewed papers.
Guided Customization: Mix Your Formula
- Load the Base: Open the .potx in PowerPoint, selecting the lab master for protocol-focused decks.
- Infuse Data: Paste reaction rates into line graphs, auto-scaling axes for accuracy.
- Tune Visuals: Apply the spectral scheme, ensuring colors differentiate phases like gas versus solid.
- Animate Dynamics: Sequence element appearances to mimic real-time fizzing or bubbling.
- Finalize Output: Export to video for async reviews or PPTX for group edits.
Versus vanilla PowerPoint's clunky chem symbols, this template's assets align effortlessly, cutting prep from days to hours while maintaining publication-ready aesthetics.
The Reaction Edge: Why Chemists Choose This
It's the nuances - like pH scale gradients that adjust logarithmically or icon sets drawn from IUPAC guidelines - that build trust. For grant writers, the budget pie charts tie funding to reaction scales, visually advocating for resources. Novices appreciate the drag-and-drop simplicity, while pros value the extensibility for custom assays.
Grab the Chemical Reaction PowerPoint template for $22 and catalyze your next breakthrough - your audience will thank you for the clarity.
Frequently Asked Questions
What makes the diagrams scientifically accurate?
They're based on standard notations, with editable elements like arrows and bonds that adhere to common lab conventions.
Can I use this for biology as well as chemistry?
Yes, diagrams like cell cycles and ecosystems extend seamlessly to biological contexts.
How do the color schemes work?
Seven options, from neutral to thematic, allow quick swaps to fit presentation tones or data types.
Is animation support included?
Fully - use built-in transitions to simulate processes like diffusion or crystallization.
What's the compatibility range?
Works best in PowerPoint 2016+, with vectors ensuring crispness on high-res displays.
Are there icons for specific equipment?
Over 40, including pipettes, centrifuges, and reactors, all scalable and recolorable.