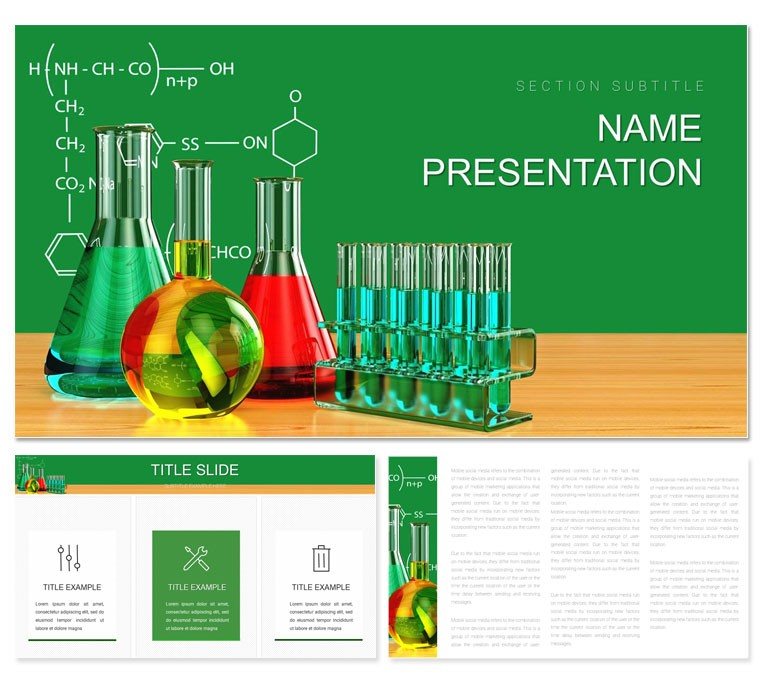
In the fast-paced world of scientific discovery, your slides need to match the rigor of your research. The Analytical Chemistry PowerPoint Presentation Template is crafted for chemists, researchers, educators, and lab professionals who want visuals as sharp as their analyses. Boasting 28 specialized diagrams, three adaptable masters, three background styles, and seven color palettes, it turns methodologies into mesmerizing flows and data into digestible insights.
From spectroscopy breakdowns to chromatography overviews, this template equips you to showcase experimental results without the hassle of from-scratch designs. Compatible across PowerPoint versions from 2016 onward, it integrates effortlessly with your lab notes or datasets. Think of it as the visual partner that amplifies your findings, much like how renowned labs present at conferences to spark collaborations.
Discover the Essential Tools for Scientific Storytelling
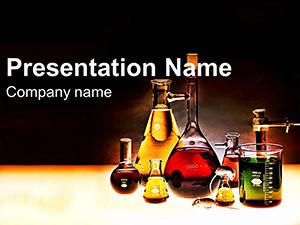
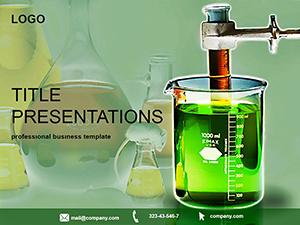
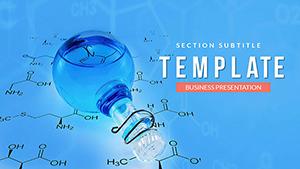
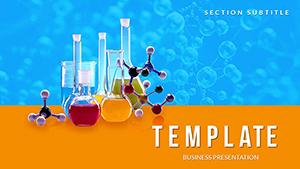
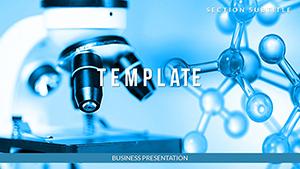
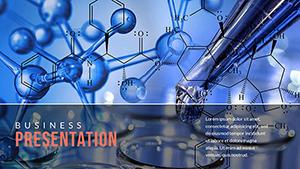
This template's strength shines in its thoughtful construction. The three masters offer flexibility: a clean canvas for abstracts, a grid-focused one for results tables, and a narrative-driven layout for conclusions. Pair them with three backgrounds - ethereal blues for molecular themes or crisp whites for clinical precision - to set the stage.
Dive into the 28 diagrams, each honed for chemistry contexts. A process flow for titration curves? Editable nodes let you input pH values precisely. Or a scatter plot for quantitative assays, where trend lines auto-adjust. Seven color schemes range from monochromatic for formal papers to contrasting hues for interactive sessions, all vector-sharp for zoom-proof clarity.
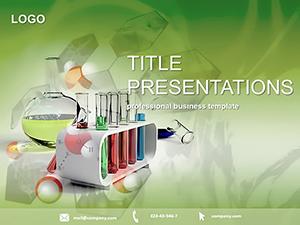
- Lab-Relevant Icons: Beakers, pipettes, and spectral lines - over 40 symbols to annotate without clutter.
- Modular Sections: Built-in dividers for methods, results, and discussions, streamlining your structure.
- High-Res Exports: Print-ready at 300 DPI, ideal for posters or journals.
These elements ensure your deck isn't just informative - it's inspiring, inviting questions that lead to breakthroughs.
Practical Scenarios: Bringing Lab Work to Life
Consider a graduate student defending a thesis on spectroscopic techniques. With this template, they embed UV-Vis graphs into timeline slides, revealing absorption peaks with layered animations. The outcome? A defense that flows logically, engaging advisors like a well-orchestrated experiment.
For workshop leaders, use radial diagrams to compare analysis methods, customizing segments for accuracy rates. In corporate R&D, leverage comparison tables for experimental findings, highlighting variances side-by-side. It's a go-to for anyone bridging lab benches and lecture halls.
- Gather Your Elements: Copy-paste spectral data into chart placeholders for instant visualization.
- Build the Sequence: Sequence slides from hypothesis to validation using connector arrows.
- Polish for Delivery: Tweak colors to match institutional branding, then rehearse with embedded timings.
Such steps demystify complex topics, making your audience active participants in the science.
Guide to Customizing Your Chemistry Deck
Launch the template in PowerPoint and choose your master to anchor the design. The slide sorter reveals thumbnails of all 28 diagrams - preview a gel electrophoresis layout, then insert it via simple drag. Edit by selecting shapes; formulas update linked values automatically for mass spectrometry plots.
Incorporate images of chromatograms by aligning them to frame placeholders, with crop tools built-in. For interactivity, add hyperlinks between related slides, like jumping from methods to raw data appendices.
Handy advice: Align text boxes to gridlines for symmetry, ensuring equations display crisply via equation editor integration. Export variants for virtual meetings or in-person talks, all while keeping file sizes lean for quick shares.
Standing Out from Generic Science Slides
Unlike stock PowerPoint templates with vague charts, this one embeds chemistry-specific axes - like wavelength scales on line graphs - reducing setup time. No generic clipart; icons are stylized for modern labs, evoking precision without dated vibes.
Collaboration-friendly, the .potx version lets teams iterate without version conflicts, syncing changes via OneDrive. It's the upgrade that turns routine reports into riveting recaps of innovation.
Ignite your next presentation with clarity and flair - secure the Analytical Chemistry PowerPoint Template for $22 and let your data dazzle.
Frequently Asked Questions
Does it include pre-built equation support?
Yes, placeholders integrate with PowerPoint's equation editor for seamless chemical formula insertion.
Are the diagrams resizable without quality loss?
All elements are vector-based, so resizing maintains sharp resolution for any output.
Can I use it for non-chemistry science topics?
While optimized for chemistry, the diagrams adapt well to general scientific presentations.
How do I add my own images?
Simply drag lab photos or graphs into designated frames; auto-crop and align features help.
Is it suitable for online webinars?
Definitely - lightweight design ensures smooth performance in tools like Zoom or Teams.
What's the update policy?
Lifetime access with free minor updates for compatibility.