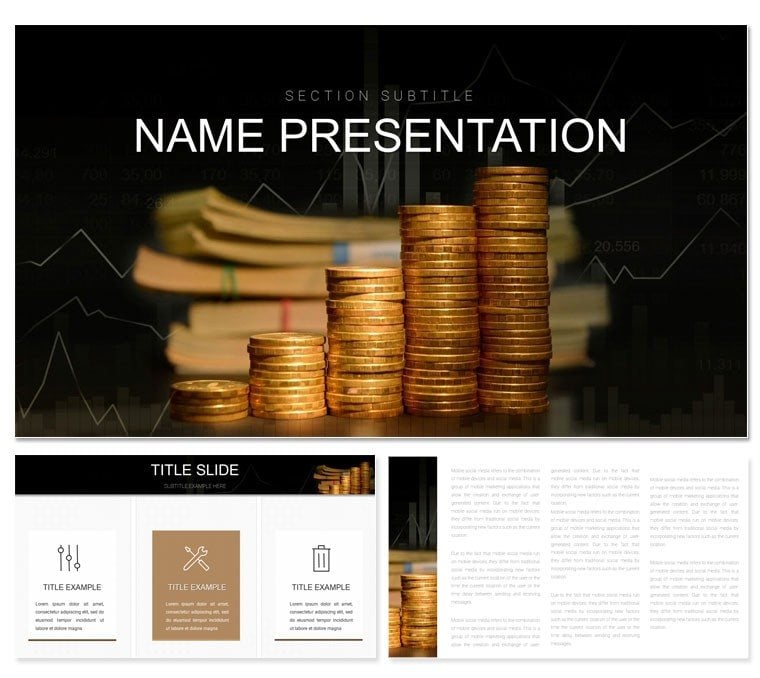
In the world of finance, where numbers tell stories and decisions hinge on clarity, your presentations can make or break a strategy session. Enter the Financial Management PowerPoint template - a powerhouse for controllers, CFOs, and accounting teams who demand precision without the pixel-pushing. This collection of 28 diagrams isn't just visual aids; it's a framework to dissect balance sheets, forecast cash flows, and spotlight fiscal health in ways that resonate with stakeholders.
Built with the rigors of quarterly reviews in mind, the template offers three master slides and backgrounds that set a tone of reliability - sleek lines and balanced layouts mirroring the equilibrium you strive for in ledgers. Seven color schemes let you dial in the vibe: cool tones for audit summaries, warm hues for growth projections. Every diagram invites your data, from pie slices representing expense breakdowns to cascading waterfalls charting budget variances. Editable down to the finest detail in PowerPoint, it's your shortcut to decks that inform and inspire action.
Think of it as the visual equivalent of a well-audited spreadsheet - transparent, scalable, and ready to scale with your narrative. Finance pros often draw from structured visuals like these in board packs, akin to how top consultancies layer insights for executive buy-in. Here, you command that sophistication, tailored for everything from departmental huddles to investor calls.
Essential Tools for Fiscal Mastery
The template's 28 diagrams cover the spectrum of financial visualization, from foundational bar stacks for revenue streams to advanced Sankey flows for fund allocations. With three masters ensuring thematic unity, your deck feels cohesive, whether you're diving into asset management or liability tracking. Backgrounds provide subtle depth - a faint grid for data-heavy slides or a clean canvas for executive overviews - while keeping file sizes lean for seamless sharing.
Adaptation is intuitive: drop in your figures via linked tables, and the charts update dynamically. The icon suite features ledger symbols, currency markers, and growth arrows, all resizable without distortion. Color schemes are pre-vetted for accessibility, ensuring contrasts pop on any display.
- Diagram Spectrum: Gantt charts for project budgeting, donut rings for debt ratios, and matrix grids for risk assessments.
- Scheme Flexibility: Seven palettes, from corporate neutrals to accent-driven sets for emphasis on key metrics.
- Format Options: .potx for templating, .pptx for hands-on work, .jpg for static exports.
These aren't generic placeholders; they're engineered for the nuances of financial discourse, letting you emphasize variances or trends with precision.
Effortless Customization for Daily Use
Launch the template, apply a master, and build from there - insert a slide, select a diagram, and populate with your ERP exports. For a balance sheet review, the hierarchical tree map organizes assets by category, with hover-friendly labels for drill-downs. Adjust opacities on layered elements to highlight discrepancies, a trick that keeps audiences focused on implications over ink.
Integrate with your workflow: hyperlink diagrams to source files or embed formulas for real-time recalcs. It's particularly handy for multi-scenario planning, where the slider control slide lets you toggle between base and optimistic forecasts visually.
Practical Scenarios in Financial Control
Apply this template across your fiscal calendar with ease. In a monthly close meeting, use the funnel diagram to trace revenue from leads to collections, annotating bottlenecks with editable notes. For board-level overviews, the dashboard aggregator slide compiles KPIs into one glanceable pane, complete with gauge icons for quick health checks.
During budget season, the roadmap timeline lays out fiscal years, marking milestones like tax filings or capital raises. Customize milestones with your firm's icons, turning a dry calendar into a strategic journey map. Or, in compliance training, the cycle diagram illustrates audit loops, reinforcing processes with animated sequences.
- Statement Analysis: Leverage area charts to overlay year-over-year comparisons, shading deviations for discussion points.
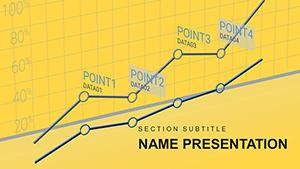
- Forecast Presentation: Bubble plots size opportunities by impact, positioning them on axes of feasibility and timeline.
- Team Alignment: Swimlane flows delineate responsibilities in expense approvals, clarifying handoffs.
A finance manager might refine the heat map for regional performance, coloring cells by profitability to guide resource shifts - transforming data dumps into decision drivers.
Boosting Boardroom Impact
Enhance with transitions that mimic data flows, like a fade-in on cumulative totals, guiding eyes to totals. Speaker prompts embedded in notes cue your delivery, ensuring you tie visuals back to business outcomes. The template's 16:9 aspect ratio fits modern setups flawlessly, from Zoom shares to conference walls.
Beyond Basics: Why Choose This for Finance
Stock PowerPoint tools often falter on detail - misaligned legends or rigid scales. This template counters with auto-formatting rules and theme-locked elements, maintaining polish as you iterate. It's broader than niche finance packs, adapting to HR budgeting or sales forecasting with minimal tweaks.
Pair it with add-ins for advanced calcs, but its standalone strength lies in the curated icons and layouts that evoke trust - essential when stakes involve bottom lines.
Secure Your Financial Edge Today
Empower your next review with visuals that clarify and captivate. Secure the Financial Management PowerPoint template for $22 and redefine how you present prosperity. Download now - your balance sheet's best advocate awaits.
Frequently Asked Questions
Does this template support data import from Excel?
Yes, diagrams link seamlessly to Excel sheets for automatic updates upon refresh.
What PowerPoint versions work best?
Optimized for 2016 and above, with full feature support on recent builds.
Can I resize diagrams without quality loss?
All elements are vector-scaled, preserving sharpness at any dimension.
How do I switch color schemes?
Access via the Design tab - apply globally or per slide in seconds.
Is it suitable for Mac users?
Fully compatible with PowerPoint for Mac, including animations and masters.
Are custom icons included?
A dedicated finance icon library is built-in, expandable via PowerPoint's insert tools.