Markets move in mysterious ways, but your presentations shouldn't. This Euro, Bitcoin Gold Price, Charts PowerPoint template is the compass for analysts, traders, and finance advisors navigating forex waves, crypto surges, and commodity climbs. With 28 insightful diagrams, three analytical masters, and three market-mirroring backgrounds, it plots your points with precision.
Suited for volatility breakdowns or portfolio reviews, it graphs gold standards alongside digital assets seamlessly. Candlestick proxies and trend lines turn numbers into narratives that hold sway. At $22, it's the smart trade for decks that deliver dividends. Position your pitches for peak performance and let the charts do the talking.
Market Movers: Key Template Traits
Three masters anchor axes - titles as tickers, legends as disclaimers. Backgrounds reflect boards: grid lines for precision or subtle charts for depth.
28 diagrams deal the data: bull-bear balances, volatility vortices. Seven schemes signal trends - crimsons for downturns, emeralds for upswings. Vectors vault over pixelation in zooms.
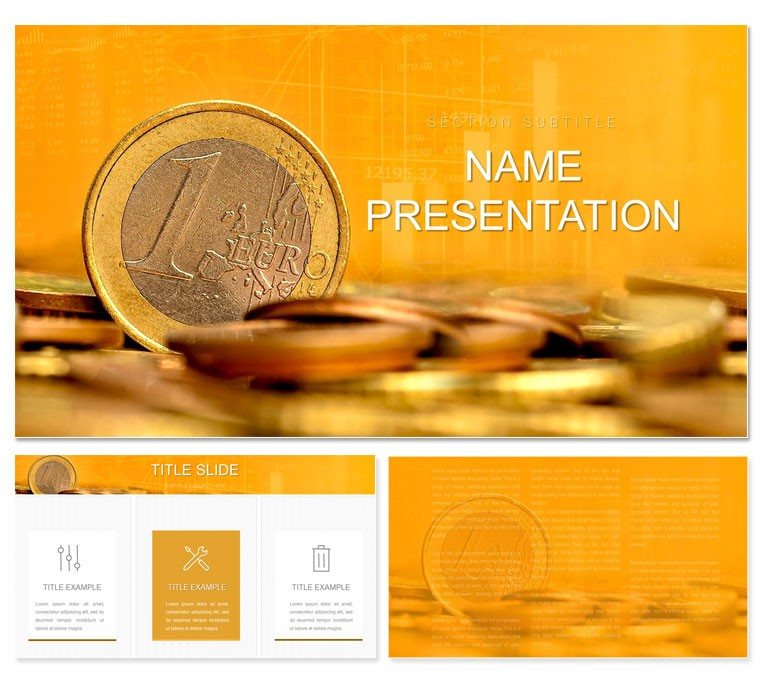
- Asset Icons: Coins, bars, and euros for labeled legends.
- Scale Sliders: Adjustable ranges for time-series spans.
- Correlation Clouds: Tag maps linking asset interplays.
Trades in PowerPoint 2016+, with formula ties to live feeds.
Trading This Template in Finance Forums
For a crypto report, index to slide 6's multi-line tracker. Plot BTC against EUR, shade fills for divergence - the scales auto-sync for fair comparisons.
Gold hedgers harness slide 23's ratio radar, spokes radiating purity premiums. An advisor charted this for client diversification, forging loyalty through lucid layouts.
Portfolio Polish Steps
- Open Positions: .pptx load, Master for broker badges and date stamps.
- Trend Tweaks: Line tools refine peaks; add trendlines via Insert.
- Data Deposits: Paste from Bloomberg; pivots recalculate instantly.
- Volatility Variants: Colors > Preset for bull/bear flips.
- Close Out: Morph transitions, export SVG for reports.
This sequence hedges against hasty designs.
Superior to Spreadsheet Screenshots
Raw exports blur under scrutiny; this clarifies with pulse animations and the matrix on slide 19 correlating pairs orthogonally. Hyperlink to TradingView for interactive drills.
Asset Applications for Market Minds
Forex forecasters funnel pairs through decision diamonds. Portfolio managers map allocations with pie proxies.
Link to Yahoo Finance: refresh scatters with quotes. In boardrooms, muted tones temper intensity.
Edge tactic: Overlay Fibonacci retracements on waves for tech analysis.
Fusing with Finance Flows
Interfaces with MetaTrader backtests or Excel models. .potx prototypes quarterly quorums uniformly.
Shared sessions update like tickers, aligning global gazes.
Buy low, present high - acquire for $22 and chart courses to acclaim.
Frequently Asked Questions
Linkable to live data?
Yes, via OLE for real-time refreshes.
2016+ full suite.
Pro trading use?
Granted for advisory and internal decks.
Complex chart types?
Includes Gantt for durations, radar for multis.
High-res exports?
Supports 300DPI for print-ready PDFs.