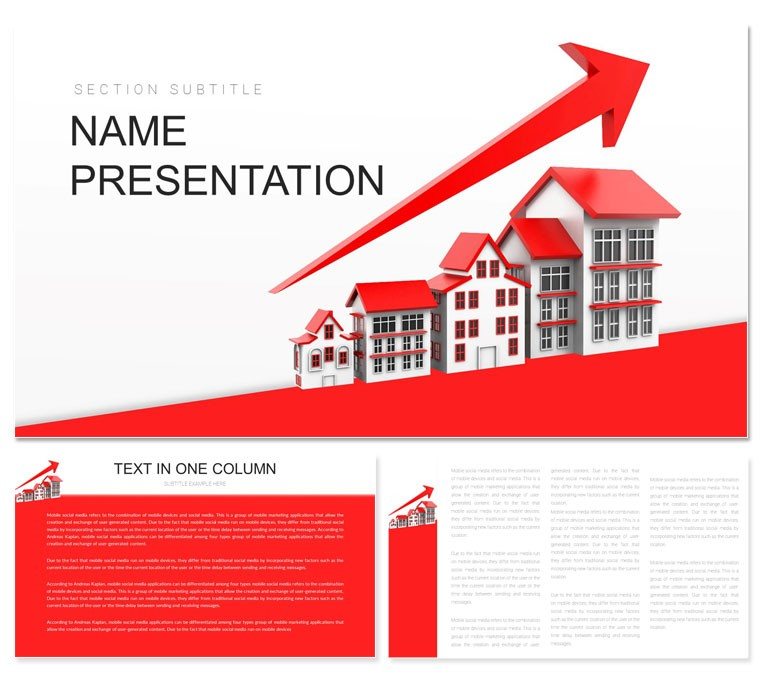
Envision a conference room where your slides don't just show numbers - they paint pictures of booming neighborhoods and smart investments. The Housing Prices PowerPoint template steps into that vision, delivering a sleek framework for real estate agents, analysts, and developers to showcase price fluctuations, valuation models, and trend forecasts. Tailored for those high-stakes property pitches, this template turns dense data into digestible visuals that guide buyers, sellers, and investors toward confident choices.
Boasting 28 targeted diagrams, three master slides for consistent branding, and three background styles ranging from urban chic to suburban calm, it's built for flexibility. Seven color schemes let you evoke luxury with metallics or trust with blues, all editable in PowerPoint 2019 or higher. At $22, it's a steal for elevating your deck from standard to standout, complete with slots for photos of gleaming listings or charts that trace appreciation over time.
Key Elements That Build Estate Narratives
At its heart, the template's minimalist aesthetic foregrounds your content, with typography that's sharp yet approachable - like a well-negotiated contract. Kick off with a master slide featuring a faint skyline silhouette, setting the stage for discussions on housing dynamics.
The 28 diagrams cover essentials: bubble charts for price-per-square-foot comparisons, heat maps highlighting hot markets, and line graphs projecting future values. Customization flows naturally - resize icons of homes and keys, tweak text for local zoning details, or animate paths showing buyer journeys from search to settlement. It handles multimedia effortlessly, embedding virtual tour videos or audio testimonials to add authenticity.
- Targeted Visuals: Sankey diagrams for fund flows in developments, perfect for financing overviews.
- Quick Edits: Color-code regions on maps to spotlight undervalued gems.
- Dynamic Inserts: Layer in 360-degree property spins for immersive appeal.
Guided Walkthrough: Assembling Your Real Estate Story
Launch the template and select your preferred background - perhaps a soft gradient evoking sunset over rooftops. Head to slide 8, a scatter plot for correlating prices with amenities; plug in your MLS data, and the axes scale automatically, freeing you to add callout bubbles for standout features like waterfront views.
For deeper dives, slide 14's waterfall chart dissects cost breakdowns - edit segments for renovation budgets, then apply a fade-in animation to reveal each layer, building suspense like unveiling a renovated interior. Draw from pros like Zillow's trend reports, adapting their clarity to your local market insights for pitches that land offers.
- Link spreadsheets for live price updates during volatile sessions.
- Incorporate high-quality listing shots, aligning them with descriptive overlays.
- Rehearse with slide sorter to pace your flow from overview to close.
Practical Scenarios: From Listings to Listings
Real estate thrives on visuals that sell dreams, and this template delivers. An agent might deploy slide 21 - a donut chart for market share slices - to compare agency performances, instantly highlighting your edge in luxury segments. Clients nod along, envisioning their portfolio growing.
Developers briefing councils could use diagram 26's Gantt for construction timelines tied to price impacts, with bars color-shifted to flag delays. This precision fosters trust, much like transparent comps in negotiations. For investors, the radial timeline on slide 4 maps appreciation cycles, helping forecast flips in emerging suburbs.
Versus plain PowerPoint, this outshines with themed elements - like escrow icons - that add context without effort. Pro advice: Pair charts with narrative prompts in notes, turning data into dialogues that uncover client needs.
Specific Strategies for Estate Pros
In commercial real estate, leverage pyramid slides (9-13) for lease structure hierarchies, apexing at rental yields. Customize with floorplan inserts for visual leases. Residential flippers benefit from before-after sliders on diagram 19, animating transformations to underscore value adds.
For market reports, assemble collage views in early slides, blending stats on inventory with neighborhood vibes via photo grids. Integrate with CRM tools for seamless data sync, then polish here for boardroom-ready finesse. Secure your edge - download this template and start mapping paths to closed deals.
Proven Techniques for Viewer Captivation
Enhance stickiness by aligning visuals to pain points: for buyer seminars, spotlight affordability trends with interactive polls embedded via hyperlinks. Use the palette variations - warm tones for growth stories, cools for risk assessments - to subtly steer emotions.
Rooted in designs vetted by industry users, it ensures crisp rendering on projectors or screens for open houses. Beyond slides, it's the blueprint for presentations that not only inform but inspire action in the ever-shifting housing landscape.
Frequently Asked Questions
Can I use this template in Google Slides?
Absolutely, export to Google Slides for team collaboration on real estate decks.
What types of diagrams help with price analysis?
From line graphs for trends to bubble charts for valuations, all 28 are tweakable for housing data.
Is multimedia integration straightforward?
Yes, drop in videos of property walkthroughs or audio market updates with ease.
How do the color schemes apply to branding?
Seven options let you match agency logos, from corporate neutrals to vibrant accents.
Does it work for commercial real estate too?
Perfectly - adapt diagrams for office yields or retail space breakdowns.
What's included beyond diagrams?
Three masters and backgrounds for full-deck cohesion in your presentations.