 Click to zoom
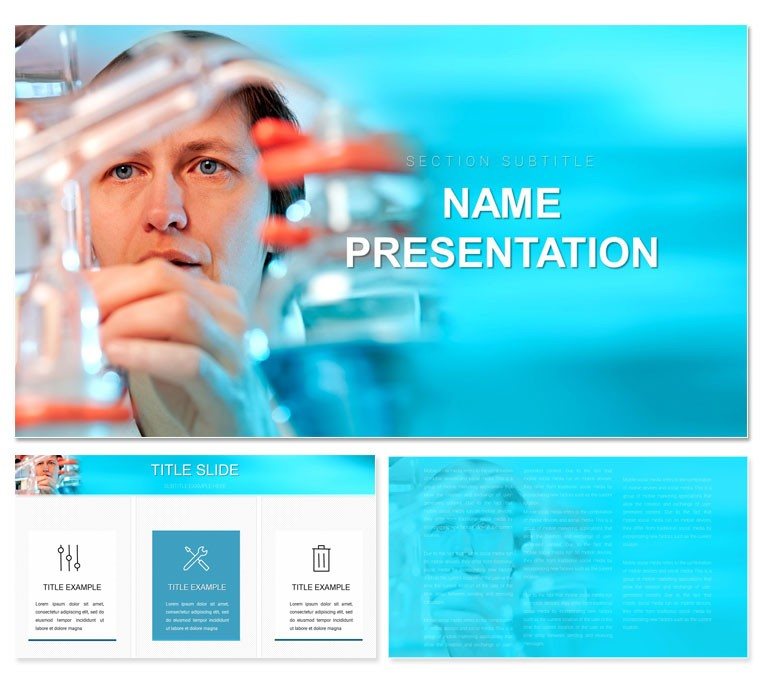
Research Lab PowerPoint Template
| Format | .pptx |
| Slides | 3 unique layouts |
| Aspect ratio | 16:9 |
| Compatibility | PowerPoint |
| Animated | No |
| Language | English |
| License | Commercial |
| File size | — |
| Version | v1.0 |
| Last updated | March 2023 |
What's inside
In the bustling heart of innovation, where hypotheses ignite and data dances, the Research Lab PowerPoint Template becomes the canvas for your scientific symphony. Geared toward lab directors, PhD candidates, and R&D teams in biotech or materials science, this set of 28 diagrams distills complex experiments into compelling visuals. From protocol timelines to result matrices, it empowers you to showcase discoveries that propel careers and collaborations forward, all within a framework that's as rigorous as your methods.
The template's clean, white-backed design - punctuated by cool blues and grays - evokes the sterility and focus of a lab bench, with typography that prioritizes readability over ornament. Fully tweakable in PowerPoint 2016+, it offers seven color schemes to align with grant proposals or conference themes. Envision defending your thesis: populate a methodology slide with your workflow icons, and the narrative self-assembles. Drawing from the structured reporting in Nature journals, this tool translates peer-review polish to everyday lab meetings.
For researchers under deadline pressure, it's a liberator - frees you to hypothesize boldly while handling the visuals. At $22, it's an accessible upgrade to your toolkit, turning raw logs into launchpads for impact.
Robust Features Fueling Lab Narratives
Built for depth, the diagrams tackle the research arc with precision-engineered elements that withstand scrutiny.
- Experimental Schematics: Flowcharts for protocols, with nodes for variables and controls.
- Data Dashboards: Modular charts for spectra, yields, or statistical outputs.
- Team and Project Maps: Org charts linking personnel to milestones.
- Versatile Bases: Three masters and backgrounds, primed for equations or micrographs.
Scalable vectors ensure lab-scale details hold up under projector glare. A biochemist might splice gel images into an analysis slide, using alignment guides for pixel-perfect fits.
Editing Hacks for Lab Efficiency
- Sync with instruments: Import CSV data to auto-populate trend lines.
- Animate sequences: Reveal reaction steps via wipes, mimicking time-lapse.
- Theme cohesion: Lock fonts in the slide master for uniform professionalism.
These refine your deck to mirror the iterative precision of experimental design.
Dynamic Deployments in Scientific Settings
For a cross-disciplinary symposium, sequence slides from hypothesis to validation: the intro grid sets objectives, mid-deck graphs unpack findings, and closers project implications. Peers nod in recognition of the logical build.
In grant writing workshops, customize project timelines to forecast budgets, embedding Gantt-style bars for temporal clarity. The adaptability shines in pivoting from wet-lab to computational models.
Featured Slide Spotlights
Notable ones:
- Methodology Matrix: Tabular layout for reagents and conditions, expandable rows.
- Results Radar: Polar plots for multi-metric comparisons.
- Future Horizons: Roadmap infographic for extensions, with milestone markers.
They tackle thorny issues like variable interactions, akin to visualizations in ACS publications.
Outpacing DIY Science Slides
This trumps ad-hoc builds with its lab-tuned layouts - handles formulas without warping, collaborates via cloud shares. Vital for virtual colloquia, it renders consistently across platforms. Investigators value its clarity in distilling noise to signal, fostering questions that advance dialogues.
A materials engineer reworked the yield analysis for a funding pitch, tagging interactive elements for demo flair. The verdict? Secured resources that accelerated prototypes.
Amplify your lab's voice with visuals that experiment-proven - acquire the Research Lab template today.
Frequently Asked Questions
What slide types cover data presentation?
Tables, graphs, and infographics tailored for quantitative and qualitative results.
Can I include chemical structures?
Yes, vector placeholders support ChemDraw imports or direct drawing tools.
Suitable for interdisciplinary teams?
Absolutely, neutral designs adapt to fields from biology to engineering.
How about multimedia integration?
Slides accommodate video embeds for demos or simulations.
Customization depth?
Full access to shapes, colors, and layouts for total personalization.
Good for
- Project roadmaps and sprint plans
- Product launch timelines
- Quarterly or annual review decks
- Company history and milestone summaries
Licence
reviews
Used the competitor analysis matrix for a strategy deck.
The axis labels for price vs quality were standard.
Helped position our product in the market.
A bit basic but effective.
The bubble sizes for market share were useful.
FAQ
Will it work in Google Slides?
Are fonts embedded?
Can I use this for client work?
What's the refund policy?
Do you update the template after purchase?
Similar templates
See all PowerPoint Templates →
All 1 slides