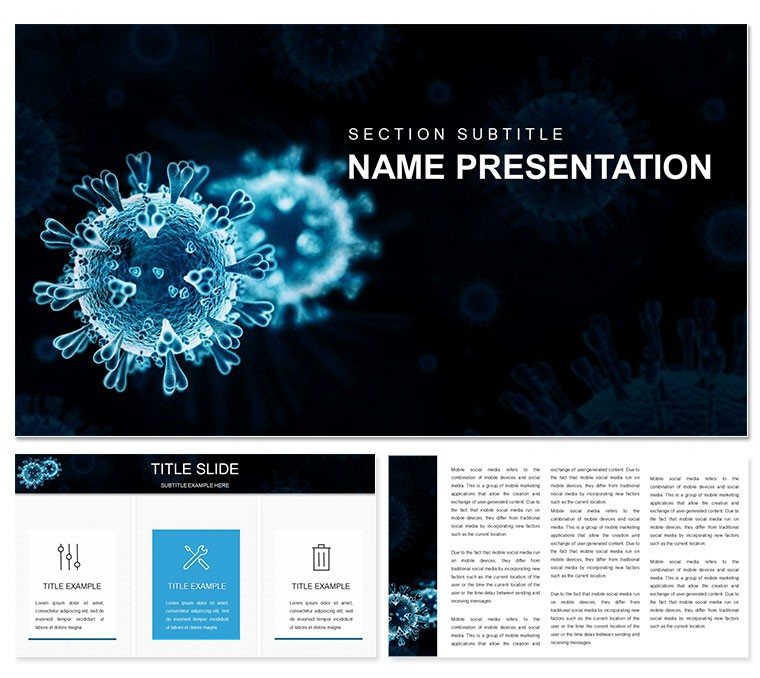
Health conversations hinge on understanding - demystifying pathogens to demystify fears, guiding from symptoms to solutions. This Medical PowerPoint Template for Infections serves as your clinical canvas, with 28 diagrams dissecting diseases for physicians, nurses, and public health advocates. In PowerPoint's versatile space, it crafts lectures or briefings that heal through clarity.
From viral cycles looping transmission to antibiotic timelines charting recoveries, these visuals humanize science. Suitable for beginners yet robust for experts, the template, from PowerPoint 2016+, folds in anatomical icons and flow arrows, with subtle animations tracing infection spreads - like ripples in a petri dish.
Healing Highlights: Features Tailored for Medical Minds
Three masters frame the format - headers labeling sections like "Etiology," footers citing sources - with three backgrounds: sterile whites for labs, soft pastels for patient edu. The 28 diagrams navigate infection arcs: etiology maps to prophylaxis plans.
Standout: the pathogen pyramid, bases broadening from vectors to hosts in outbreak models. Or the symptom spectrum, a radial wheel segmenting signs by severity for triage guides. Seven schemes blend clinical cools with urgent warms, vectors preserving detail in zooms for journals.
- Anatomy-Accurate: Layered organs in cross-sections, peelable for progression stages.
- Evidence Links: Hyperlinks to PubMed abstracts, enriching without clutter.
- Motion Maps: Animate diffusion gradients for bloodstream invasions.
Inspired by CDC visuals, a med school instructor animated viral replications, cycles looping to reinforce replication rates in virology classes.
Clinic Calibration: Shaping Slides for Your Scenario
- Start strong: Align a master with your outline - diagrams like cycle wheels preset for common bugs.
- Infuse facts: Populate transmission trees with stats, branches forking by mode.
- Treat visuals: Shade efficacy bars in therapy charts, gradients showing response curves.
- Engage end: Transition fades reveal prevention shields, building to empowerment.
This flow fosters comprehension over confusion.
Casebook Chapters: Deploying in Health Horizons
For outbreak briefings, the epi curve plots incidence peaks, bars rising like fever charts in flu seasons. Patient consults? The differential diagnosis table contrasts mimics, rows ruling out with check icons.
Community workshops use resistance radars, spokes extending for superbug threats, prompting hygiene pledges. A public health nurse tailored the vaccination cascade to local drives, drops illustrating coverage gaps that boosted uptake.
From Wards to Workshops: Versatile Vitality
Pediatric rounds simplify with cartoon vectors, bugs as friendly foes in story slides. Research posters scale organ flows for grant pitches. Beyond stock med images, these contextualize - prevention pies slicing strategies, evoking balanced diets for immunity.
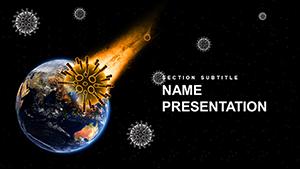
For global health, the vector migration map traces spreads, contours curving travel routes.
Therapeutic Thread: Merging with Your Med Workflow
Import from EHR screenshots or embed WHO infographics, integrity held. Schemes comply with medical color codes. Pro move: Tag slides with ICD codes for quick archival searches.
Diagnose your decks with this Medical PowerPoint Template for Infections - knowledge that cures ignorance.
Frequently Asked Questions
PowerPoint version needs?
From 2016, with bells in 365 for collaborative edits.
Editable for specific diseases?
Wholly - swap labels and icons for TB, COVID, or beyond.
Include anatomical accuracy?
Yes, vetted illustrations for reliable teaching tools.
Good for public education?
Excellent, with simplified language prompts and engaging icons.