In the fast-paced world of medical research and pharmaceutical reporting, clarity isn't just nice - it's essential. This Laboratory Tests PowerPoint template steps in as your reliable lab partner, offering 28 specialized diagrams that distill complex test data into visuals as sharp as a microscope lens. Tailored for scientists, clinicians, and pharma professionals, it features seven color schemes to match institutional palettes, all fully editable in PowerPoint 2016 and beyond. From correlation matrices to sequential process flows, each slide is built to highlight dependencies and outcomes, ensuring your audience grasps nuances without the fog of dense spreadsheets.
Picture presenting trial results to stakeholders: instead of bullet-point overload, you reveal trends through intuitive graphs that tell the story of efficacy and safety. With three master layouts and backgrounds, customization flows as smoothly as a well-run experiment, integrating images of pipettes or charts seamlessly. This isn't mere decoration; it's a tool that empowers your expertise to shine, bridging lab benches to boardrooms with authoritative design.
Essential Features for Scientific Storytelling
The template's backbone is its diagram collection, each crafted to represent data interplays - like how one biomarker influences another - making abstract results tangible. High-resolution elements ensure print-ready quality, while animation options add depth to reveal layers progressively.
- Targeted Diagrams: 28 slides including line graphs for time-series test evolutions and Venn diagrams for overlapping diagnostic criteria, all vector-based for infinite resizing.
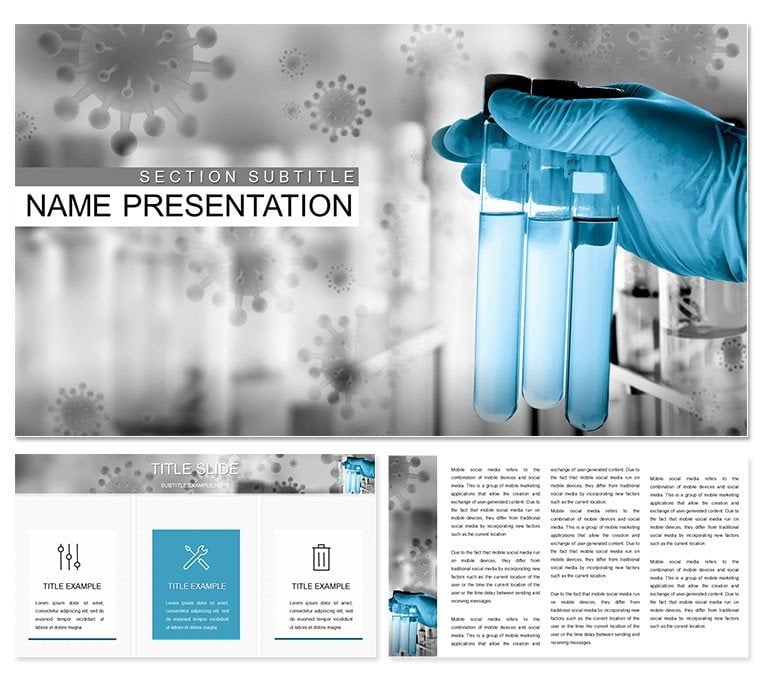
- Color and Edit Flexibility: Switch among seven schemes effortlessly; alter text, icons (like test tubes), or data points to fit your protocol.
- Multimedia Readiness: Layer in video demos of lab procedures or audio explanations, with transitions that mimic analytical progression.
- Structured Foundations: Three masters provide consistent headers for slide numbers or lab titles, keeping your deck cohesive.
These features draw from best practices in scientific communication, where visuals clarify what words alone can't, as seen in peer-reviewed journals' figure designs.
Practical Applications in Medical and Pharma Settings
A researcher unveiling Phase II trial data might use the scatter plot slide to plot dosage responses, color-coding by patient cohorts for instant pattern recognition. In a hospital grand rounds, a pathologist could adapt the flowchart for biopsy workflows, guiding viewers through diagnostic steps with embedded annotations.
For pharma sales teams, the comparison matrix becomes a powerhouse for drug efficacy versus competitors, subtly incorporating molecular structure icons. These uses underscore the template's versatility, turning routine reports into compelling cases that drive decisions.
Guided Workflow: From Data to Delivery
- Import Your Dataset: Launch the template, select a master, and populate a base chart with your CSV - PowerPoint's data tools handle the import smoothly.
- Visualize Relationships: Choose a dependency graph; link variables to show causal links, like reagent concentrations affecting yields.
- Enhance with Media: Add a short clip of a titration process, animating it to unfold alongside your explanatory text.
- Polish for Presentation: Align colors to your lab's branding, test animations for flow, and rehearse to ensure timing aligns with your narrative.
- Share Impactfully: Export to PDF for handouts or present live, confident that visuals reinforce your findings.
This approach streamlines what could be hours of manual formatting, freeing you for deeper analysis.
Standing Out from Standard Slides
Where default PowerPoint options falter with generic grids, this template infuses pharma-specific motifs - subtle nods to lab equipment - while maintaining neutrality for broad use. It's cross-platform friendly, ensuring your precision holds up in any venue, from conferences to telehealth sessions.
One clinician noted how such structured visuals clarified a diagnostic pathway in a team huddle, fostering quicker consensus. Adapt it to your needs, and let data speak volumes.
Elevate your next report with clarity that commands attention. Secure this Laboratory Tests PowerPoint template for $22 today and refine your scientific discourse.
Frequently Asked Questions
How editable are the diagrams for custom data?
Fully editable - update data series, labels, and scales directly in PowerPoint without losing design integrity.
What multimedia can I incorporate?
Insert videos of lab simulations, audio narrations, or images of specimens, all supported natively.
Are there specific themes for pharma?
Yes, icons and layouts evoke medical precision, but they're adaptable for general science too.
What's the compatibility range?
Works seamlessly with PowerPoint 2016 through the latest versions on Windows and Mac.
Can I use it for non-lab presentations?
Absolutely; the graphs suit any data-driven talk, like environmental testing or quality control.
How many backgrounds are included?
Three versatile backgrounds to set the tone for your session.