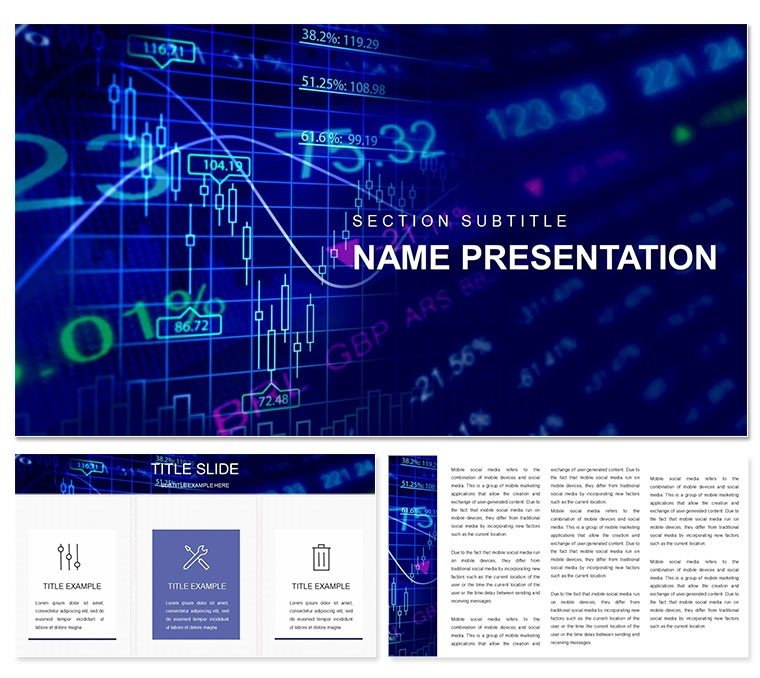
In the fast-paced world of international trade and finance, conveying the intricacies of exchange rates can make or break your message. Enter the Exchange Rate Economics PowerPoint Template - a robust resource crafted for economists, financial analysts, and business leaders aiming to illuminate how currency fluctuations shape economies. Boasting 28 diagrams that dissect factors like interest rates, inflation, and trade balances, this template turns dense theory into digestible visuals.
Picture yourself in a high-stakes conference, where your slides need to not only inform but captivate. This toolkit delivers with intuitive layouts that guide viewers through causal relationships, such as how a strengthening dollar ripples through export markets. Fully editable in PowerPoint 2019 and beyond, you can infuse your data, adjust infographics for regional relevance, or embed live feeds from economic APIs for up-to-the-minute accuracy. It's more than slides; it's a bridge from complexity to comprehension.
Drawing inspiration from how institutions like the IMF structure their policy briefs, use the interconnected flowcharts to map geopolitical influences on forex trends, fostering discussions that lead to actionable strategies. Whether educating students on monetary policy or briefing C-suite on hedging risks, this template empowers you to present with poise. Step up your economic storytelling - explore how these visuals can anchor your next analysis.
Essential Features That Drive Economic Clarity
This template's strength lies in its layered approach to visualization, blending data-driven elements with user-friendly customization to suit diverse economic narratives.
- Comprehensive Diagram Set: 28 slides covering everything from balance-of-payments models to volatility forecasts, each primed for data overlays.
- Seven Tailored Color Schemes: Select schemes that mirror economic themes - cool tones for stability analyses or warms for inflationary warnings.
- Three Master Layouts and Backgrounds: Ensure brand-aligned cohesion, with space for annotations or embedded videos of market simulations.
These components facilitate a polished flow, where each chart builds on the last, much like sequential models in econometric forecasting.
Guided Integration: Building Your Economic Deck
- Gather Core Data: Pull exchange rate histories from sources like Bloomberg, then populate the line series for trend spotting.
- Refine Visuals: Scale axes uniformly across slides to compare currencies side-by-side, enhancing cross-market insights.
- Incorporate Explanations: Use tooltip-style callouts to define terms like 'carry trade,' keeping novices engaged.
- Animate Pathways: Sequence arrows to trace cause-effect chains, revealing how policy shifts propagate.
- Review for Precision: Cross-check with real-world benchmarks, exporting to shareable formats for global teams.
Such a methodical build echoes the rigor in academic economic papers, yielding presentations that stand scrutiny.
Targeted Use Cases for Economic Professionals
From classroom lectures to boardroom forecasts, this template adapts to where economics meets application, solving common pain points like overwhelming datasets.
For financial analysts, the correlation matrices visualize asset sensitivities to currency swings, ideal for portfolio reviews. Economists might deploy the Sankey diagrams to illustrate capital flows between regions, clarifying imbalances in trade talks. Business pros can leverage bubble charts for scenario planning, plotting GDP impacts under varying exchange scenarios.
In educational settings, the pyramid structures break down theoretical frameworks, like Mundell-Fleming models, into layered insights for student absorption. Each case highlights a benefit: precision without perdition, where editable elements let you pivot from theory to tailored takeaways.
Beyond Basics: Elevating Over Native Tools
Standard PowerPoint graphs often falter on nuance, demanding manual recalibrations for multi-variable plots. This template counters with pre-configured axes and legends, plus thematic motifs like globe icons for international contexts - streamlining what could be a tedious overhaul into a swift enhancement.
The result? Decks that not only inform but intrigue, fostering deeper engagement than off-the-shelf alternatives.
Pro Tips for Compelling Currency Conversations
To amplify your template's potential, anchor visuals in context: precede a forex volatility chart with a real event, say a central bank announcement, to ground abstractions. Maintain a narrative arc - open with global overviews, narrow to specifics, close with implications - guiding audiences like a well-plotted econometric path.
For virtual delivery, optimize transitions to mimic market pulses, and include high-contrast modes for accessibility. These strategies, rooted in effective economic communication, ensure your slides don't just show data - they spark strategies.
Seize the moment to refine your economic discourse with this template - download it now and navigate the currency currents with finesse.
Frequently Asked Questions
What economic topics does this template cover?
It focuses on exchange rate drivers like inflation and trade, with diagrams for factors and impacts.
Are the slides fully customizable?
Yes, graphs, charts, and infographics are editable to fit your specific data and branding.
Who is the ideal user for this template?
Financial analysts, economists, business professionals, and educators seeking clear economic visuals.
Does it support multimedia integration?
Absolutely, insert videos or audio for dynamic elements like market commentary clips.
How many diagrams are included?
There are 28 diagrams, each with seven color scheme options for flexibility.
Is it compatible with Google Slides?
Import the PPTX file into Google Slides for collaborative editing, with full feature retention.