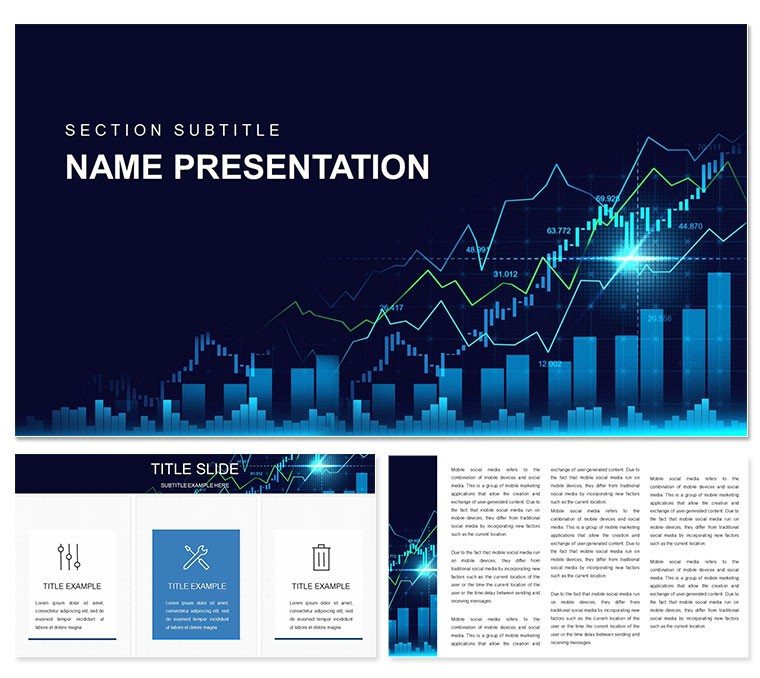
For traders navigating the volatile seas of stock exchanges, the right visuals can mean the difference between insight and oversight. The Trading Technical Analysis PowerPoint Template equips you with 28 specialized diagrams to dissect price movements, volume surges, and order flows with surgical precision. Tailored for stock analysts, day traders, and investment advisors, this collection demystifies tools like candlestick patterns and tape reading, turning chaotic data into coherent strategies.
Envision a trading floor briefing where your slides reveal hidden trends before they surface - that's the edge this template provides. Built for PowerPoint 2016+, it features vector-based elements you can scale for intraday charts or long-term overviews, customizing colors to signal buy/sell zones or embedding real-time feeds from platforms like TradingView. Beyond mere plotting, it fosters a deeper understanding of market psychology, where behavioral models predict reversals.
Similar to how quantitative funds visualize algorithmic signals, employ the momentum oscillators here to highlight divergences, sparking debates on entry points. Whether prepping for client portfolios or internal strategy huddles, this template transforms technical jargon into accessible narratives. Ignite your analytical arsenal - discover how these charts can calibrate your trading compass.
Key Components Fueling Technical Precision
The template's architecture prioritizes adaptability, with features that align directly with trading workflows for swift, insightful builds.
- Diverse Diagram Arsenal: 28 layouts spanning head-and-shoulders formations to Bollinger Bands, each ready for historical data infusion.
- Seven Thematic Color Sets: Opt for reds-greens for bullish-bearish cues or neutrals for neutral analyses.
- Three Flexible Masters and Backgrounds: Anchor your deck with grids suited for tickers or news overlays.
This setup ensures your presentations pulse with market relevance, evolving as trades unfold.
Streamlined Setup: Crafting Analysis Decks
- Source Market Data: Import tick data from CSV files to animate price bars dynamically.
- Tune Indicators: Adjust moving averages via shape properties, syncing with your preferred periods.
- Layer Annotations: Pin Fibonacci retracements with draggable lines for support level calls.
- Sequence Reveals: Animate volume spikes to precede price breaks, mimicking live tape.
- Validate Outputs: Simulate backtests visually, then package for broker shares.
This ritual, akin to routines in prop trading firms, yields decks that anticipate rather than react.
Practical Scenarios: From Floor Trades to Portfolio Reviews
Trading demands visuals that cut through noise - this template delivers by targeting scenarios where technicals tip the scales.
In day trading sessions, the relative strength index slides flag overbought conditions, guiding scalps with precision. For swing traders, envelope channels map breakout potentials, integrating volume confirmations to filter false signals. Investment advisors can use Elliott Wave diagrams to project cycles, aligning client expectations with wave counts.
Even in educational webinars, the order book simulations clarify depth-of-market dynamics, bridging theory to terminal practice. Each scenario leverages a core advantage: modularity, where swapping datasets refreshes entire analyses without redesign.
Outpacing Default Charting
Native PowerPoint tools lag in trading specifics, often requiring add-ins for RSI or MACD. Here, pre-loaded formulas and stylized axes handle complexities natively, plus motifs like arrow clusters for momentum - elevating amateur sketches to pro-grade illustrations.
Consequently, your time shifts from tool tinkering to trade theorizing, a boon for high-frequency minds.
Insights for Sharper Technical Deliveries
Maximize this template by contextualizing charts: pair a doji pattern slide with historical case studies, like infamous flash crashes, to underscore rarity. Employ consistent timeframes across views to weave a unified story, and for remote audiences, embed hyperlinks to live charts for interactivity.
Accessibility matters too - label axes phonetically for global teams. These nuances, inspired by chartists' playbooks, ensure your visuals not only analyze but advocate for informed positions.
Empower your trading talks with this template - grab it today and trace the trends that triumph.
Frequently Asked Questions
What trading tools are featured in the diagrams?
Diagrams include patterns, volume analysis, order flow, and forecasting elements like moving averages.
Can I edit the chart formulas?
Yes, underlying calculations are accessible via PowerPoint's data tools for custom indicators.
Is this suitable for beginners in technical analysis?
While geared toward pros, the clear layouts aid novices in grasping basics like support lines.
How do the color schemes aid trading?
Schemes highlight bullish/bearish zones intuitively, with seven options for varied market views.
Does it support real-time data links?
Link to external sources like Excel for updates, though manual refreshes may apply in presentations.
Compatibility with other software?
Primarily PowerPoint, but exportable to PDF or importable to Keynote with layout tweaks.