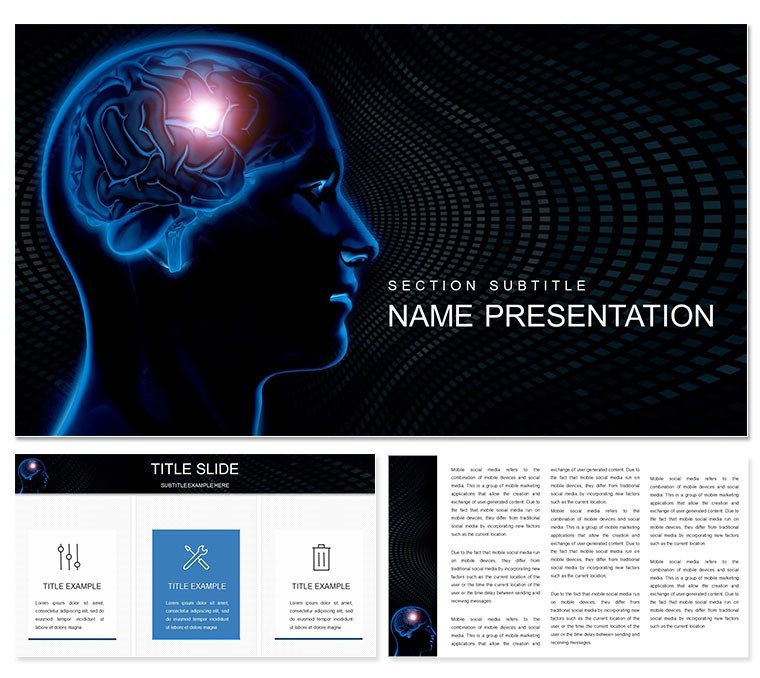
Picture the brain as a bustling archive, where memories flicker like old film reels and emotions surge like sudden storms - now imagine presenting that archive with slides that make every viewer lean in closer. The Brain Center for Memory and Emotion PowerPoint Template does just that, equipping medical educators, researchers, and business leaders in wellness sectors with 28 intricate diagrams to explore how the mind records, stores, and recalls information while scanning for survival cues. Compatible with PowerPoint 2016 onward, this set includes three masters and backgrounds, letting you craft decks that blend science with storytelling for conferences or team trainings.
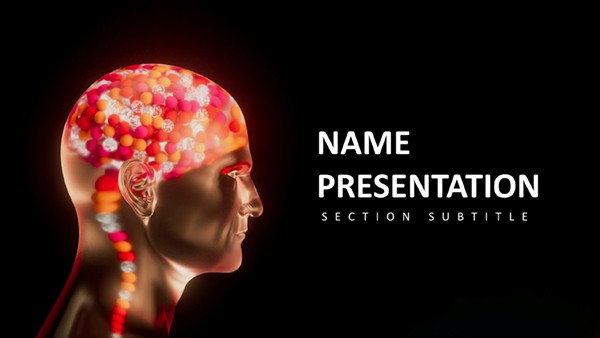
Central to its appeal is the way it visualizes psychophysiological loops - from encoding experiences in the temporal lobes to emotional tagging via the limbic system. With seven color schemes, you can evoke calm seas for memory consolidation or fiery reds for threat detection, all while keeping edits intuitive. Vector precision means enlarging amygdala illustrations for emphasis won't blur, ideal for dissecting fear responses in high-stakes pitches.
Key Tools for Illuminating Neural Narratives
Designed with depth in mind, the features cater to those decoding the brain's emotional core. Memory palace diagrams guide users through spatial recall techniques, while emotion wheels segment feelings into core affects, editable for cultural nuances.
- Rich Diagram Set: 28 visuals, including consolidation cycles and threat-scanning matrices, with space for hypothesis annotations.
- Adaptive Layouts: Masters allow global tweaks, like bolding key terms such as "hippocampal replay."
- Engagement Boosters: Pre-set paths for fade-ins, revealing layered brain sections progressively.
Particularly useful is the integration slide, linking memory lapses to emotional overloads, a staple for neurology workshops.
From Research Reviews to Wellness Workshops
This template bridges lab insights to real-life applications. In medical rounds, sequence slides to trace episodic memory formation, using timelines that highlight rehearsal phases. Business trainers adapt emotion maps for leadership sessions, plotting stress responses to foster resilience discussions.
Building Educational and Scientific Decks
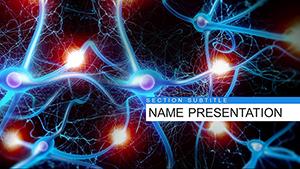
For a seminar on cognitive biases, open with a threat bias overview, then layer in memory distortion diagrams. Customize by adding poll results to pie charts showing recall accuracy under duress. It outshines plain slides with specialized motifs like neural fireworks for synaptic strengthening.
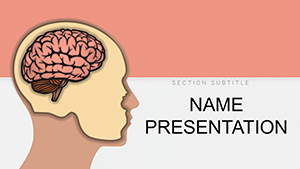
- Select a master suited to your focus - abstract for emotions, anatomical for memory.
- Embed data flows, tracing info from sensory gates to storage vaults.
- Incorporate case vignettes, overlaying fictional patient journeys on generic models.
- Wrap with implication summaries, using bullet hierarchies for action steps.
Recall how experts diagram survival instincts: A radar chart fans out vigilance zones, underscoring evolutionary roots.
Facilitating Therapeutic and Corporate Insights
In counseling, the emotion-processing flowcharts clarify therapeutic interventions, with branches for cognitive reframing. For corporate wellness, remix storage hierarchy slides to address burnout, visualizing overload as fragmented files.
Unlike stock templates, these come with brain-specific icons - lightbulbs for insights, locks for repressed memories - infusing authenticity into every frame.
Pro Tips for Dynamic Delivery
Enhance with PowerPoint's zoom features to navigate brain regions interactively. For collaborations, use the .potx for version control, merging inputs seamlessly. In remote formats, opt for high-res exports to maintain detail in shared views.
Acquire the Brain Center template for $22 and turn abstract concepts into tangible takeaways - elevate your next session with mind-melding visuals.
Frequently Asked Questions
What aspects of the brain does this cover?
It focuses on memory encoding/storage and emotion processing/threat detection.
Are diagrams beginner-friendly?
Yes, with toggleable complexity layers for varying audience depths.
Can I integrate external data?
Certainly, charts accept CSV imports for personalized stats.
Does it work on Mac?
Fully compatible with PowerPoint for Mac 2016+.
How editable are the colors?
Seven schemes, plus manual overrides for bespoke palettes.