Every year, the annual report lands like a financial compass, guiding stakeholders through a company's triumphs and trials. The Annual Report Analysis PowerPoint template equips you to navigate this terrain with finesse, delivering slides that dissect profit and loss statements, cost breakdowns, and key metrics from the report's core. Aimed at finance directors, auditors, and reporting specialists, it bridges the gap between dense data and digestible insights, making complex analyses feel straightforward and strategic.
With 28 targeted diagrams, three masters for varied emphases, and three backgrounds to suit boardroom gravitas, this template is optimized for PowerPoint 2016+, promoting effortless team edits. Move beyond static tables to dynamic visuals that reveal trends at a glance - whether highlighting cost efficiencies or projecting future fiscal health. It's the antidote to presentation fatigue, where viewers glaze over numbers; instead, spark discussions that propel forward momentum.
Key Components Driving Your Report Mastery
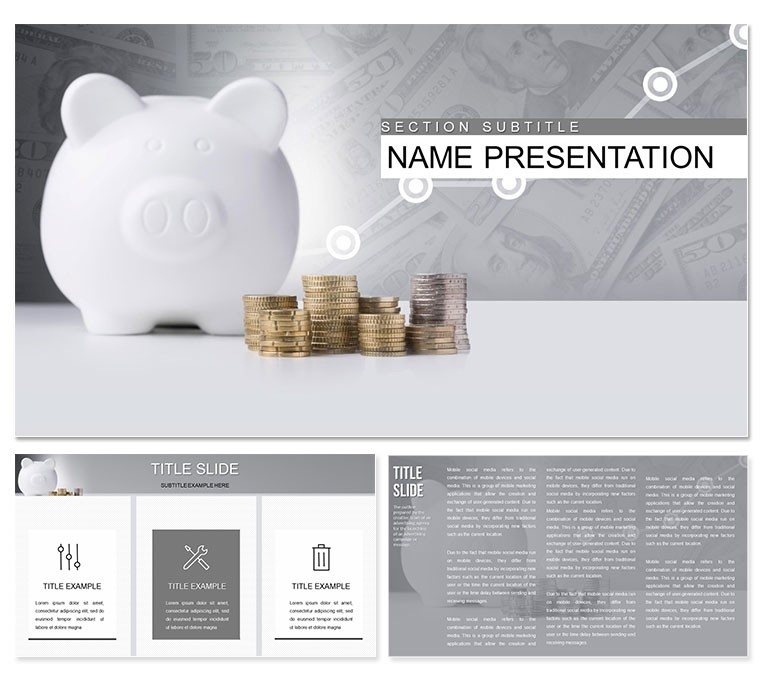
Foundationally, the three masters provide scaffolding: one for narrative-driven sections with ample note space, another for chart-centric dives, and a third for summary dashboards. Backgrounds range from stark white for precision to muted earth tones for approachable analysis, ensuring your deck adapts to formal or informal settings.
The 28 diagrams form the powerhouse, each honed for report specifics. Visualize a balance sheet via hierarchical trees, or use waterfall diagrams to cascade from gross revenue to net profit, with editable segments for element-specific costs. Seven color schemes - crisp monochromes to subtle gradients - facilitate branding, while icons like trend arrows and ledger icons inject clarity without excess.
- Smart Chart Automation: Formulas embedded in some diagrams auto-calculate totals as you input figures.
- Export Versatility: .pptx for full edits, .potx for reusability, .jpg for handouts.
- Modular Builds: Pre-grouped layers let you toggle visibility for simplified or detailed views.
Such features empower you to iterate reports annually with minimal rework, focusing on interpretation over illustration.
Targeted Scenarios: Elevating Report Deliveries
In board presentations, this template excels at unpacking the profit and loss statement. A finance lead could deploy a Sankey diagram to flow expenses from operational to administrative, pinpointing variances against budgets. For investor updates, pivot to heat maps in diagram 20, coloring cost overruns red to flag risks while greens celebrate savings.
Auditors appreciate its utility in compliance reviews, using timeline diagrams to sequence report milestones from data collection to filing. Integrate appendices seamlessly by hyperlinking summary slides to detailed breakdowns, streamlining Q&A flows.
Crafting a Cost Analysis Section: A Guided Walkthrough
- Layout Choice: Select the chart master with neutral background for objective tones, framing your intro slide with report objectives.
- Expense Mapping: Load diagram 9's clustered column chart with economic element costs, sorting bars by magnitude.
- Trend Revelation: Add line overlays from diagram 16 to connect year-over-year changes, emphasizing efficiencies.
- Annotation Enhancements: Place callout icons on peaks for narrative ties, like linking a spike to supply chain shifts.
- Conclusion Synthesis: Conclude with a radar chart on the summary master, plotting performance across cost categories.
This sequence not only structures your content but amplifies its persuasive power, turning reports into roadmaps.
Surpassing Conventional Analysis Tools
Where standard PowerPoint demands piecing together shapes, this template offers cohesive, report-aligned diagrams that hold format under scrutiny. Generic alternatives often ignore financial hierarchies; here, tree maps naturally nest sub-costs under mains. For distributed teams, version control via .potx keeps analyses uniform, while subtle animations - fading in variances - guide focus without flair overload.
Pro tip: Use slide sorter view to sequence diagrams logically, from macro overviews to granular dives, for narrative cohesion. Test on projectors early to verify color fidelity in low-light.
Make your next annual review a beacon of insight. Acquire the Annual Report Analysis template and illuminate the path ahead.
Frequently Asked Questions
Can diagrams handle large datasets from reports?
Yes, scalable vectors and linked data features accommodate extensive figures without lag.
Are there templates for specific report sections?
Diagrams cover P&L, costs, and summaries comprehensively, with mixes for custom sections.
Does it integrate with accounting software visuals?
Import screenshots or data exports easily, with editable overlays for seamless blending.
How many color options for professional tones?
Seven schemes, from conservative neutrals to accented palettes for varied emphases.
Is mobile viewing optimized?
Designs scale well for tablets, though best on desktop for editing depth.