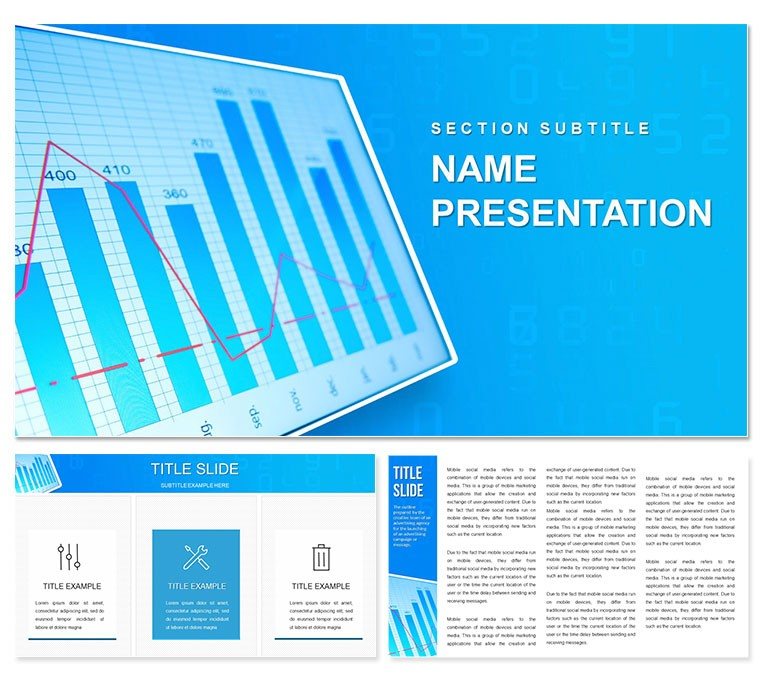
Imagine wrapping up a fiscal year not with a stack of dry spreadsheets, but with a presentation that captivates your board, investors, and stakeholders. That's the power of a well-designed annual report. This Annual Report PowerPoint template steps in as your ready-to-go ally, packed with 28 meticulously crafted diagrams across three masters and backgrounds. Tailored for finance leaders, accountants, and business strategists, it transforms raw data into visual stories that highlight achievements, projections, and strategic directions. No more wrestling with blank slides or mismatched charts - dive straight into customizing elements to match your brand's voice.
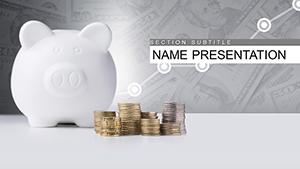
Whether you're presenting revenue growth trajectories or operational efficiencies, this template ensures every slide resonates. With seven versatile color schemes, you can align visuals seamlessly with corporate palettes, from sleek blues for trust to vibrant greens for growth. It's more than slides; it's a framework that lets you emphasize key metrics without the hassle of starting from scratch. Think of it as your shortcut to podium-ready materials that build confidence and clarity. Ready to turn numbers into narratives? Let's explore how this tool streamlines your workflow.
Unlock the Core Features for Effortless Customization
At its heart, this template shines through its thoughtful structure. The three included masters provide a consistent foundation, allowing quick swaps for title pages, content sections, or closing summaries. Pair them with the three background options - minimalist solids, subtle gradients, or patterned accents - and you've got flexibility that adapts to any report's tone.
- 28 Specialized Diagrams: From pie charts dissecting expense breakdowns to line graphs tracking year-over-year performance, each diagram is pre-built for financial depth. Swap in your data with a few clicks, and watch it animate smoothly.
- Seven Color Schemes: Choose from professional palettes that evoke reliability and precision. Edit hues directly in PowerPoint to reflect seasonal themes or departmental branding.
- Editable Everything: Text placeholders, icons, and shapes are all vector-based, ensuring crisp scalability no matter the screen size.
Compatibility runs deep too - fully optimized for PowerPoint 2016 and later versions on Windows and Mac. Sources come in .pptx for immediate use, .potx for theme integration, and .jpg previews for quick shares. This setup means you spend less time troubleshooting and more on refining your message.
Real-World Applications: From Boardrooms to Investor Calls
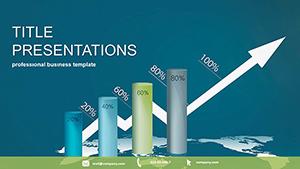
For a CFO at a mid-sized firm, annual reports aren't just compliance - they're opportunities to showcase resilience amid market shifts. Use this template to build a section on financial health: Start with a dashboard slide aggregating KPIs like EBITDA margins and cash flow ratios. The built-in bar diagrams let you stack comparisons effortlessly, revealing trends at a glance.
Consider a step-by-step walkthrough for integrating sustainability metrics, a growing must-have in modern reports. First, select the eco-themed background for visual harmony. Next, populate a timeline diagram with milestones - say, carbon reduction targets met over quarters. Layer in infographics for supply chain impacts, editing tooltips to include sourcing details. Finally, transition to a forecast slide using the line diagram, projecting future ROI with conditional formatting that highlights optimistic scenarios.
In contrast to cobbling together basic PowerPoint shapes, this template's pre-aligned elements save hours. Where a from-scratch build might lead to skewed axes or clashing fonts, here everything snaps into place, maintaining that polished edge akin to reports from established consultancies like Deloitte.
Tailoring for Stakeholder Engagement
Engage diverse audiences by segmenting your deck. For executives, lean on executive summary diagrams that condense executive overviews into heat maps. Investors appreciate the risk assessment slides, where radial charts map out market volatilities. And for teams, motivational closing visuals with progress rings celebrate collective wins.
- Import your Excel data via linked charts for real-time updates.
- Apply animations sparingly - fade-ins on data points draw eyes without overwhelming.
- Test on projectors; the high-contrast designs ensure readability from afar.
One marketing director shared how adapting the color schemes for a client pitch turned a routine update into a standout narrative, fostering deeper discussions on growth strategies.
Streamline Your Workflow with Pro Tips
Integrate this into your routine by treating it as a living document. Post-presentation, archive versions by duplicating the master for next year's baseline. For collaborative edits, share the .potx file - team members can tweak without overwriting core layouts.
Enhance interactivity with hyperlinks between sections; jump from financials to appendices seamlessly. And for global teams, the unicode-supported fonts keep international characters intact. This isn't just a template - it's a scalable system that evolves with your organization's needs.
Picture delivering your next annual review with slides that not only inform but inspire action. Download this Annual Report PowerPoint template today and reclaim the time to focus on what matters: driving your business forward.
Frequently Asked Questions
Is this template fully editable in PowerPoint?
Yes, all elements including diagrams, text, and colors are fully editable, allowing complete customization to fit your branding.
What versions of PowerPoint does it support?
It's compatible with PowerPoint 2016 and newer versions on both Windows and Mac platforms.
How many slides are included?
The template features 28 diagram-focused slides, plus masters for expansion as needed.
Can I use it for non-financial reports?
Absolutely - its versatile diagrams work for any data-driven annual overview, like project recaps or performance audits.
Are there animation options built-in?
Basic animations are included on diagrams for smooth data reveals, and you can add more via PowerPoint's tools.