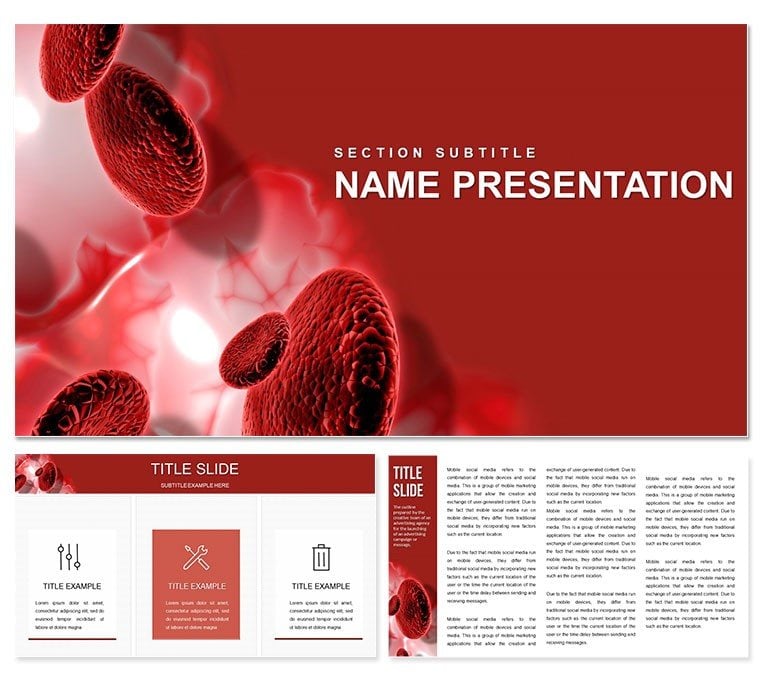
Where data meets discovery, turning lab results into lifelines for your audience. The Blood Analysis PowerPoint template presentation empowers physicians, researchers, and pharma teams to dissect hematopoiesis and inflammation with clarity. Featuring 28 insightful diagrams in seven clinical color schemes, three masters, and backgrounds, it maps deviations into actionable paths. From routine screens to research rundowns, illuminate the vital flow.
Precision vectors thrive in PowerPoint 2016+, rendering cell clusters crisp under magnification. A CBC breakdown slide, with segmented bars for counts, spotlights anomalies - colleagues correlate swiftly.
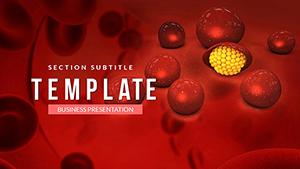
Circulate Clarity Through Slides
Core visuals like cell cycle wheels rotate phases, editable segments for mutation rates. Animate spins to trace disruptions, evoking erythroid paths.
Inflammatory cascades chain reactions: arrows link cytokines, shaded for chronicity. Pathways parsed.
Circulate in Cycles
- Tune a master to lab hues - crimson reds or sterile blues.
- Zoom a smear diagram: label leukocytes, tint rarities.
- Plot coagulation curves; peaks predict risks.
- Validate with peer previews, refining foci.
Transcends table dumps, where cells crowd confusingly.
Vital Visions for Care
Clinicians consulting use differential pies: slices size WBC shifts, legends linking symptoms. Diagnoses dawn.
Researchers reporting deploy heatmaps: gradients glow gene expressions, clusters for cohorts.
Pharma strategizing scatter survival: points plot outcomes, regressions route therapies.
Vascular Vectors
- Overlay micrograph placeholders for authenticity.
- Scheme with plasma palettes - opalescent flows.
- Hyperlink to PubChem for compound dives.
Infuse this template - vitalize your vein for $22.
Plasma-Proof Perks
Infused with WHO classifications, universal across devices. Priced at $22, it's lab-leveraged.
In trial reviews: funnel flows filter cohorts, dropouts diagrammed delicately.
Spotlight: Anomaly Atlas
The deviation dial: compass needles point pathologies, editable arcs arcing severities. Insights indexed.
Sync with EHR pulls - live labs label landscapes. You're pulsing progress.
Flow forward - download the Blood Analysis PowerPoint template presentation now.
Frequently Asked Questions
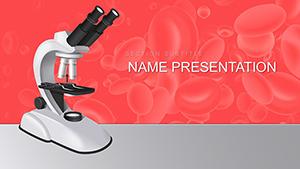
Cell-scale accuracy?
Vectors mimic microscopy magnifications.
Batch for panels?
Masters mirror multiples uniformly.
Pathway palettes?
Schemes signal systems - reds for RBCs.
Animates flows?
Sequences simulate circulations smoothly.
Export to journals?
Vector fidelity for publications.