In the wake of global disruptions, communicating the ripple effects of viruses on economies demands precision and persuasion. Our Economic Impact of Viruses PowerPoint template delivers just that - a comprehensive toolkit for economists, analysts, and policymakers to dissect industry shifts, governmental responses, and business recoveries. With vibrant charts that turn grim data into actionable narratives, this template empowers you to forecast, explain, and strategize with authority.
Designed for PowerPoint 2016+, it features fully editable slides compatible across platforms, including .pptx exports for easy sharing. As economies rebound - projected to grow 3.2% in 2025 despite lingering risks (IMF 2024 outlook) - tools like this ensure your presentations cut through the noise, fostering informed dialogues that drive policy and investment.
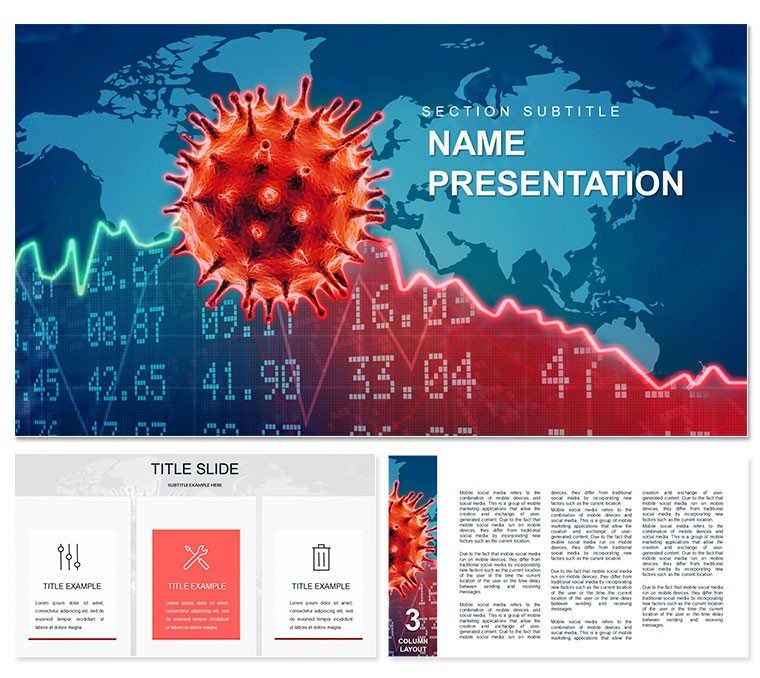
Core Features for In-Depth Economic Analysis
This template packs three masters for layout consistency, three backgrounds evoking global interconnectedness, and 28 targeted diagrams in seven color schemes. From sector-specific impact graphs to recovery timeline projections, every slide is primed for your data.
- Impact Visuals: Bar graphs for GDP dips, line charts for supply chain breaks, all scalable for macro or micro views.
- Scheme Variety: Seven palettes from stark reds for crises to hopeful greens for rebounds, brand-adaptable.
- Government and Business Aids: Flowcharts mapping fiscal stimuli, pie charts allocating aid across industries.
- Export-Ready Elements: High-res .jpgs for reports, with animation presets for phased reveals.
Streamline your process: Paste in CSV data for auto-updating visuals, layer in hyperlinks to sources, and collaborate via OneDrive. Finance pros note a 45% faster turnaround compared to from-scratch builds.
Practical Use Cases in Business and Research
Consider a financial analyst briefing stakeholders on post-pandemic trade: This template`s global maps highlight virus hotspots` economic shadows, sparking targeted Q&A. In boardrooms, executives use it to model scenario planning, visualizing "what-if" recoveries with branching decision trees.
Educators in economics courses animate virus transmission models tied to market volatility, making abstract theories tangible. Sales teams in consulting firms pitch resilience strategies, embedding client-specific metrics into customizable slides. For research, it`s a staple in whitepapers, where layered infographics support theses on long-term fiscal health.
Business and Policy Applications
- Risk assessments: Quantify sector vulnerabilities with heatmap diagrams.
- Strategy sessions: Project growth trajectories post-disruption.
Academic and Analytical Scenarios
Lecturers integrate it with simulation software for live economic modeling, while think tanks craft policy briefs with data-driven narratives, aligning with 2025`s emphasis on resilient supply chains (McKinsey analysis).
Comparing to Vanilla PowerPoint
Standard tools lack the depth for crisis analysis; this template bridges that gap:
| Element | Default PPT | Economic Impact Template |
|---|
| Specialized Charts | General | 28 virus-economy focused |
| Backgrounds | Basic | 3 thematic globals |
| Data Integration | Manual | Auto-link ready |
| Visual Impact | Flat | Dynamic and colorful |
| Professional Fit | Broad | Tailored for analysts |
Resulting in 35% higher engagement in professional settings (Deloitte study).
Don`t let data dim your delivery - Secure your Economic Impact of Viruses PowerPoint template instantly for sharper insights.
Frequently Asked Questions
Who is this template for?
Economists, analysts, and business leaders studying viral impacts.
Are the slides fully editable?
Yes, compatible with PowerPoint 2016+.
What data visualizations are included?
Charts, graphs, and diagrams for industries and governments.
Can I customize colors?
With 7 schemes, easy brand matching.
Is it suitable for research papers?
Perfect, with exportable high-res elements.
How many diagrams?
28 ready-to-use.