 Click to zoom
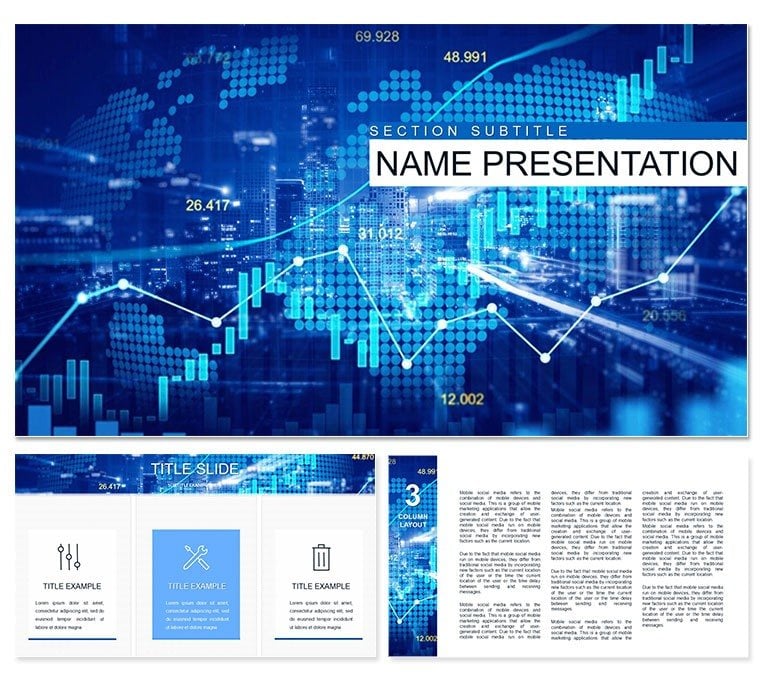
Economics Major PowerPoint Template: Visualize Social and Financial Dynamics
| Format | .pptx |
| Slides | 3 unique layouts |
| Aspect ratio | 16:9 |
| Compatibility | PowerPoint |
| Animated | No |
| Language | English |
| License | Commercial |
| File size | — |
| Version | v1.0 |
| Last updated | October 2022 |
What's inside
Economics isn`t just numbers - it`s the pulse of societies, shaping politics, morals, and markets. The Economics Major PowerPoint Template equips you to unpack these intricacies with slides that clarify rather than confuse. Ideal for analysts, educators, and policymakers, it turns abstract theories into vivid stories that influence decisions.
In 2025, as data visualization trends embrace AI-driven insights per Luzmo`s forecasts, this template`s 28 diagrams and animations position you at the forefront. Compatible across devices, it supports multimedia embeds to layer economic models with real-time videos or podcasts on global trade shifts. Whether dissecting GDP fluctuations or social equity metrics, your presentations will command attention.
Picture unveiling a dependency graph that links inflation to voter sentiment - your audience leans in, enlightened. This template fosters that `aha` moment, blending high-quality visuals with editable flexibility. Secure it now and elevate your narrative in boardrooms or classrooms.
Core Features Driving Economic Clarity
Engineered for depth, these elements make complex econ data accessible and engaging.
- 28 Specialized Diagrams: From line graphs tracking market cycles to radar charts comparing policy impacts, all in 7 color schemes.
- 3 Masters & Backgrounds: Base your deck on clean, professional layouts that adapt to themes like finance or sociology.
- Rich Animations: Animate value dependencies to reveal causal chains, perfect for illustrating supply-demand equilibria.
- Multimedia Support: Insert audio explanations of Keynesian theories or video clips from economic summits.
- Full Editability: Reshape text, colors, and images to fit your dataset, ensuring brand alignment.
Plays on virtually any PC, making it a reliable choice for cross-platform collaborations.
Integrate Effortlessly into Your Analysis Routine
Load your Excel exports into placeholders, apply a color scheme for instant cohesion, and sequence animations to pace your econ lecture. For researchers, embed Python-generated viz from tools like Tableau, as recommended for 2025 homework per Economics Homework Helper.
This streamlines from data crunching to delivery, freeing you to focus on insights over aesthetics.
Use Cases: Bridging Theory and Practice
From academia to advisory, this template adapts to where economics meets reality.
- Business Finance: CFOs modeling accounting forecasts with bar charts, highlighting ROI in volatile markets.
- Educational Lectures: Professors graphing social reproduction theories, engaging undergrads with interactive timelines.
- Policy Research: Think tanks visualizing global trade dependencies, informing 2025 tariff debates.
- Sales in Consulting: Economists pitching strategies via pie charts of sector growth, closing deals with data-backed conviction.
Leverage it for Maptive-inspired examples, like heat maps of economic disparities, to spark discussions.
Template vs. Vanilla PowerPoint: The Upgrade
Stock tools suffice for basics, but this shines in econ-specific scenarios.
ElementThis TemplateDefault PowerPointDiagrams28 econ-focusedManual buildsAnimationsData-flow tailoredBasicCustomization7 schemes, multimediaTheme-limitedCompatibilityAny computerStandardFocusSocial/econ themesGeneralResult: Deeper engagement, less effort.
Chart Your Economic Success
Empower your insights with this template - customize today for presentations that drive change. Lifetime use awaits.
Frequently Asked Questions
Best for economics students?
Yes, ideal for visualizing theories and data in assignments.
Supports video insertion?
Fully, for dynamic econ clips.
Color scheme count?
Seven for varied presentations.
Compatible with Mac?
Via PowerPoint for Mac.
Editable shapes?
Completely, for custom graphs.
Plays on old PCs?
Yes, broadly compatible.
Good for
- Project roadmaps and sprint plans
- Product launch timelines
- Quarterly or annual review decks
- Company history and milestone summaries
Licence
reviews
Used the funnel for a sales pipeline, stage names are editable.
The widths don't automatically adjust but i dragged them.
Good for a sales ops review.
The icons for each stage are decent.
Could be more automated but it's powerpoint.
FAQ
Will it work in Google Slides?
Are fonts embedded?
Can I use this for client work?
What's the refund policy?
Do you update the template after purchase?
Similar templates
See all PowerPoint Templates →

All 1 slides