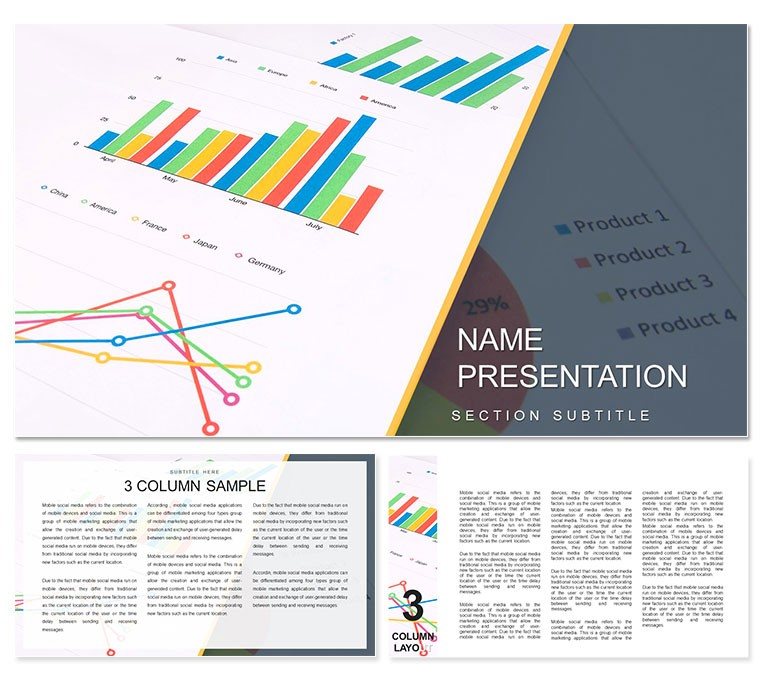
X Slides, Y Color Schemes: What You Get
28 diagrams arrive with 7 color schemes and complete POTX PPTX files.
Balance sheet cash flow and income statement diagrams link through shared visual hierarchy so numbers stay aligned across slides.
Compared to single-chart layouts this set offers zone segmentation that maintains information spacing even when data volume grows.
What is a financial statement diagram template? It is a ready-to-edit collection of 28 PowerPoint diagrams designed for business presentation of balance sheets audits and financial analysis.
Editing Capabilities at a Glance
| Feature | Details |
|---|
| Slides / diagrams included | 28 fully editable diagrams |
| Diagram categories | balance sheet cash flow income statement |
| Editable elements | shapes connectors text placeholders |
| Aspect ratio | 16:9 standard |
| PowerPoint compatibility | 2016 and newer |
| Color schemes | 7 preset palettes |
Adapting the Template to Your Brand
Step 1 - Open the POTX file in PowerPoint 2016 or later (1 minute). Step 2 - Update the slide master color palette with your brand hex codes (4 minutes). Step 3 - Replace text placeholders on each diagram (8 minutes). Step 4 - Adjust any diagram connectors if needed (2 minutes). Step 5 - Export to PDF or keep as PPTX (1 minute).
Real Scenarios
Before: 4 hours building from scratch inconsistent alignment. After: 35 minutes all diagrams consistent across 6 client decks.
A financial analyst at a mid-size manufacturing firm reused the same template file for quarterly briefings.
Each time only labels and one color scheme changed.
Download and start editing immediately
Building From Scratch vs. Starting Here
Segment labels sit outside the chart for a specific reason. When a demographic cohort represents less than 12 percent of the total interior text at readable font sizes no longer fits the segment.
External labels with leader lines maintain accuracy for every segment size including the 4 percent and 7 percent slices.
Manual creation demands moderate design skill and usually takes three hours.
Adapted the same diagram for five consecutive quarterly briefings.
Download and start editing immediately
See the finance accounting category or related audit sets for more options.
Which PowerPoint versions support this template?
PowerPoint 2016 2019 365 and Mac versions open the file without issues. The slide master structure works in all listed editions. Older versions may lose some connector formatting but core editable shapes remain intact. Test the free preview first if you run an unsupported release.
How do I change the color scheme?
Open the slide master view. Select any color swatch and replace it with your brand hex value. The change applies globally to all 28 diagrams. Individual overrides on single shapes work independently if needed. Save once and every slide updates automatically.
What does the license allow?
The license covers internal company use and client deliverables. Multiple team members can access the same file under one purchase. You may not resell the template as a standalone product. Commercial work is fully permitted.
What is included in the paid version?
The paid version includes the complete 28 diagrams 7 color schemes and full POTX PPTX files. Free previews show only static JPG versions with watermarks. All editable shapes text placeholders and connectors appear only in the paid download.
What is your refund policy?
Refunds are available within 14 days if the file does not open in your PowerPoint version. Contact support with the order number and version details. Approved refunds process within 48 hours. The policy protects both buyer and seller.
How do I update chart data?
Right-click any data-linked shape and choose Edit Data. Excel opens with pre-filled values. Change numbers and close the sheet. The diagram updates automatically. Labels and colors stay in place.