 Click to zoom
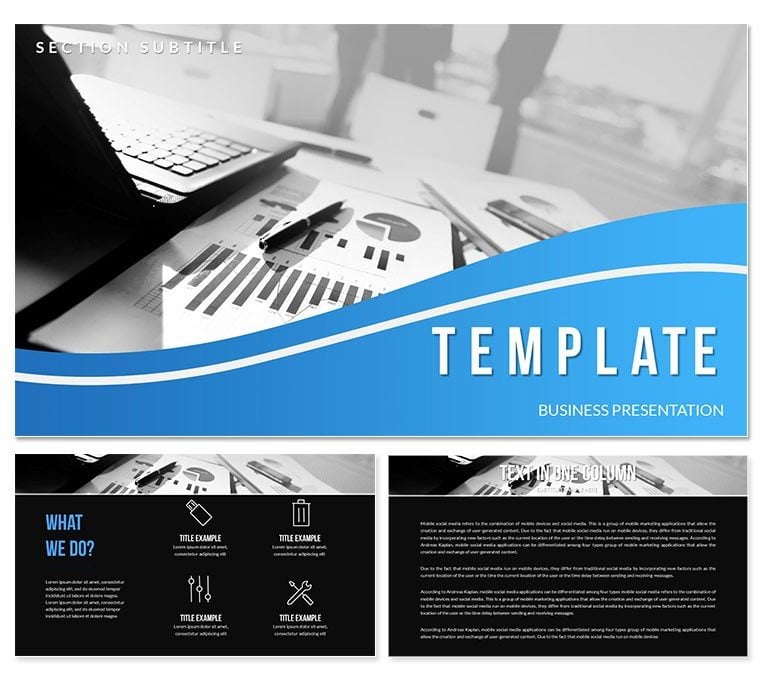
Analytics PowerPoint Template Presentation
| Format | .pptx |
| Slides | 3 unique layouts |
| Aspect ratio | 16:9 |
| Compatibility | PowerPoint |
| Animated | No |
| Language | English |
| License | Commercial |
| File size | — |
| Version | v1.0 |
| Last updated | July 2020 |
What's inside
Struggling to make sense of sprawling datasets in boardroom battles? This Analytics PowerPoint Template turns numbers into narratives that command attention and inform decisions. Designed for data-driven professionals like analysts, marketers, and executives, it streamlines your workflow, letting you focus on insights rather than formatting frustrations.
From quarterly reports to trend forecasts, its sleek layouts ensure clarity and confidence. Fully compatible with PowerPoint 2016+, this one-time buy offers lifetime use, empowering endless refinements without recurring costs.
Powerful Tools for Data Mastery
Equipped with three masters and backgrounds, plus twenty-eight versatile diagrams across seven color palettes, customization is a breeze. Edit hues to match corporate branding or audience preferences, and integrate live data links for real-time updates.
- Dashboard Overviews: Consolidate KPIs into at-a-glance panels that reveal performance at speed.
- Trend Lines and Scatter Plots: Track metrics over time, spotting patterns that predict future wins.
- Funnel Analyses: Dissect conversion paths, identifying bottlenecks with pinpoint accuracy.
- Heat Maps: Highlight regional variances, turning global data into localized strategies.
Animations bring stats to life - watch bars rise or lines connect - while vector elements scale flawlessly for any screen size. It`s intuitive enough for solo users yet robust for collaborative teams.
Proven Use Cases in Action
Envision a marketing team dissecting campaign ROI: Use funnel slides to show drop-offs, then pivot to scatter plots for A/B test outcomes, closing with recommendations that secure budget approvals. Or, in a startup pitch, layer cohort analysis via stacked bars to demonstrate user retention, swaying investors with visual proof of scalability.
Unlike vanilla PowerPoint charts that blend into the background, this template`s thematic cohesion - crisp lines, balanced whitespaces - elevates analytics to art, making dense info digestible and discussions dynamic.
Key Scenarios to Deploy It
- Performance Reviews: Benchmark teams against goals with comparative radars.
- Strategy Sessions: Forecast scenarios using predictive models in line graphs.
- Client Updates: Share progress via progress bars, fostering trust through transparency.
Why wait for clarity? Grab your Analytics PowerPoint Template today and decode data like never before.
The Edge Over Standard Tools
It packs pro tips, like embedding formulas for auto-calculations or optimizing for accessibility with alt-text prompts. User-tested for cross-platform reliability, it shines in hybrid environments, from Zoom calls to printed handouts.
Ultimately, it`s about turning analytics from chore to champion - unlocking strategies that propel growth and precision.
Frequently Asked Questions
How does this template handle large datasets?
It supports data imports from Excel, ensuring smooth handling of voluminous info without lag.
Are the diagrams fully vector-based?
Yes, for sharp rendering at any zoom level or export format.
Can I add interactive elements?
Absolutely - hyperlinks and triggers enhance navigation for deeper dives.
What`s the learning curve?
Minimal; included tutorials get you diagramming in minutes.
Does it integrate with other software?
Seamlessly with tools like Tableau exports or Google Sheets links.
Is lifetime access included?
Yes, one purchase covers unlimited projects and updates.
Good for
- Project roadmaps and sprint plans
- Product launch timelines
- Quarterly or annual review decks
- Company history and milestone summaries
Licence
reviews
Needed a quick org chart for a team meeting. This one was easy to edit and looks clean.
Used the process diagrams for a workflow presentation. They are straightforward
but I wish there were more options for branching paths.
It's a solid pack for basic diagrams. I used a Venn diagram that was perfect for a conference talk.
Couldn't find a good chart in my standard deck
so I grabbed this. It has a good mix of options.
but the design is a bit plain. It'll do for internal stuff
but I'd want something nicer for a client.
FAQ
Will it work in Google Slides?
Are fonts embedded?
Can I use this for client work?
What's the refund policy?
Do you update the template after purchase?
Similar templates
See all PowerPoint Templates →


All 1 slides