What's Inside the Download
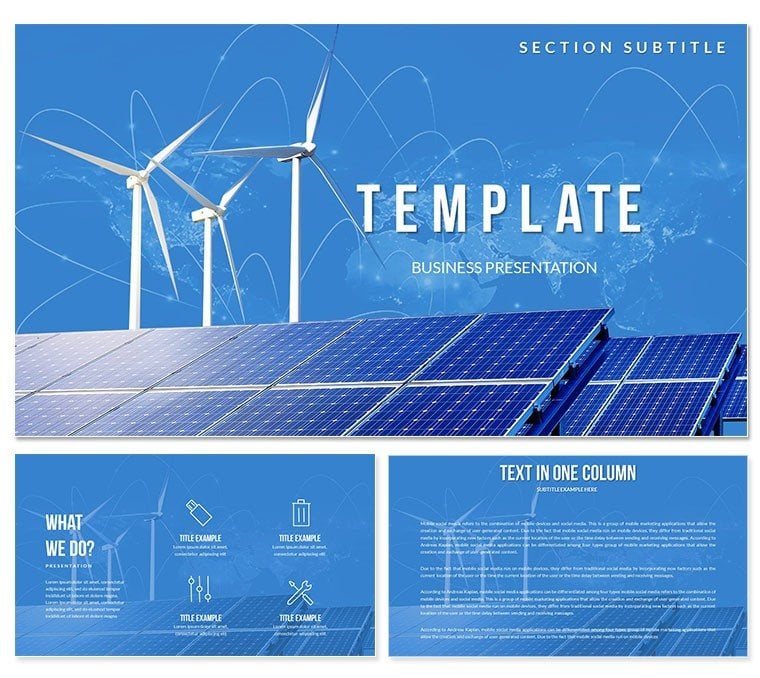
28 diagrams include turbine flow paths, solar panel grids and hybrid energy cycles.
Time estimates sit outside step boxes as secondary labels so the main process name remains the focus.
Compared to single-chart layouts the full set maintains consistent renewable color language across every slide.
Key Specifications At a Glance
| Feature | Details |
|---|
| Slides / diagrams included | 28 fully editable energy diagrams |
| Diagram categories | energy flow, capacity comparison, sustainability cycles |
| Editable elements | blades and panels resize and recolor independently |
| Aspect ratio | 16:9 standard |
| PowerPoint compatibility | 2016, 2019, 365, Mac versions |
| Color schemes | 7 presets via slide master |
| Icon layers | wind and solar icons replaceable |
Real Scenarios
The project lead asked for a maturity model slide by end of day.
The analyst had never built one.
Here is what happened - the file delivered the complete renewable cycle in 20 minutes.
completed a 28-slide deck in one afternoon without a designer
Download and start editing immediately
How to Make It Yours in Under 20 Minutes
What if I only need to change one diagram not all 28? Click directly on that slide, edit the shape fill color through Format - Shape Style.
The master slide change is for global updates; individual overrides work independently.
What if my brand color is not in the 7 presets? Select any shape, open Format - Shape Style and enter the exact hex value.
State editing difficulty: Beginner.
Compared to Starting From Zero
Creating wind and solar flow diagrams manually requires 3 hours of alignment work per chart.
Time estimates in procedure flowcharts belong outside the step boxes as secondary labels not inside them.
The step name is what the audience discusses; the time estimate is supporting context.
Putting both inside the box creates visual competition that slows reading.
Download and start editing immediately
What is a PowerPoint diagram template? A PowerPoint diagram template is a pre-designed set of editable shapes, flowcharts, and layouts in PPTX format that allow quick assembly of business or thematic presentations.
How to change the color scheme in this file: Open the Slide Master view, select the color palette at the top, click any scheme and all 28 diagrams update globally in one click.
FAQ
Does this template work in PowerPoint 2016 or newer?
Yes it opens natively in PowerPoint 2016, 2019, 365 and Mac versions. All shapes remain fully vector and editable. Older versions may lose some gradient effects but core diagrams stay intact.
How do I change the color scheme via slide master?
Go to View - Slide Master, click the top master thumbnail, then Design - Colors and pick one of the 7 presets. Every diagram updates instantly across all 28 slides. Individual overrides remain possible on any single shape.
What does the license allow for client work?
The license permits use in paid client presentations and internal church decks. You may not resell the original file or redistribute the source PPTX. One license covers one user or one organization.
What is the difference between free and paid version?
The paid version includes the complete 28 diagrams and all 7 color schemes plus the POTX master. Free previews show only sample JPG slides with watermarks and limited diagrams.
What is the refund policy?
You can request a full refund within 7 days if the file does not open or the diagrams fail to meet the listed specifications. Contact support with your order number and the issue will be resolved or refunded.
How can I update chart data?
Right-click any chart, choose Edit Data and the linked Excel sheet opens. Change numbers and close - the visual refreshes immediately on every slide.
How to export for specific destinations?
Use File - Export - Create PDF for handouts or keep as PPTX for live screen sharing. Animation settings remain active in the original format.
See more energy power templates
For related solar diagrams check Solar Energy PowerPoint Template.
Or view Windmill PowerPoint Template.