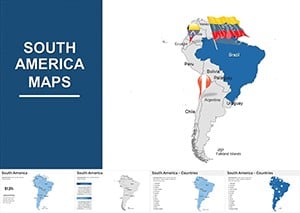
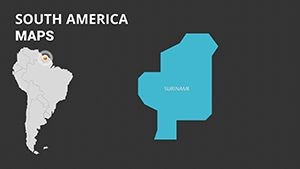
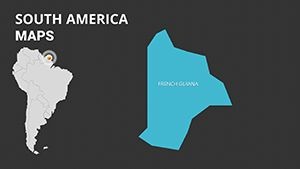
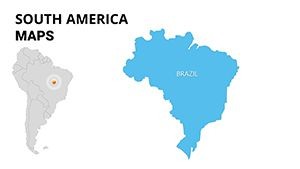
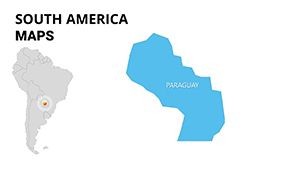
South America Maps Keynote Template: Charting Continental Narratives


Type: Keynote Maps template
Category: South America
Sources Available: .key
Product ID: KM00074
Template incl.: 34 editable slides
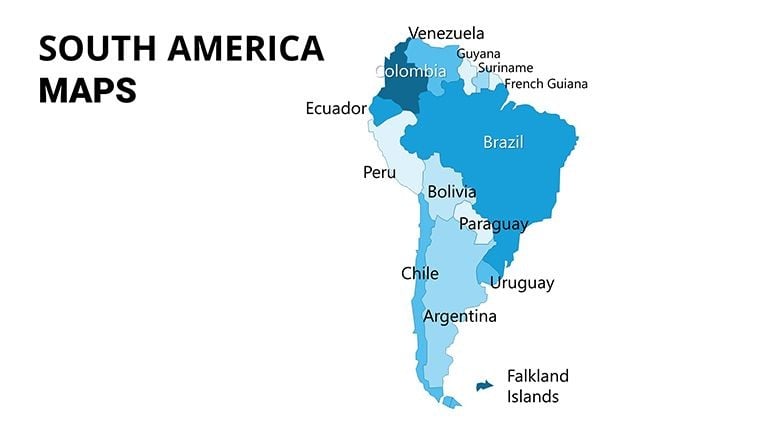
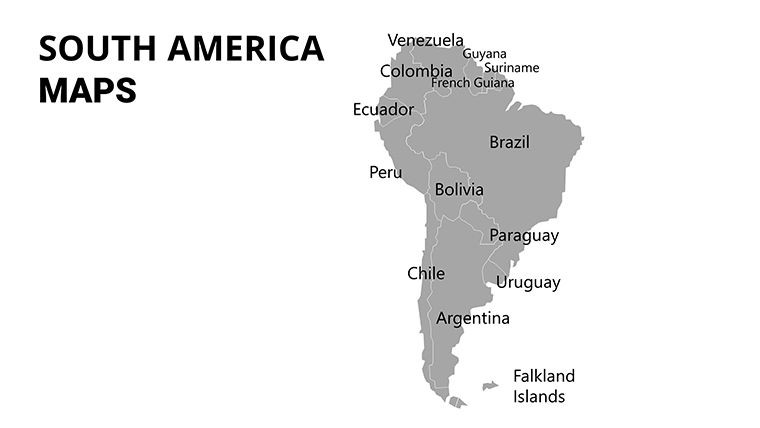
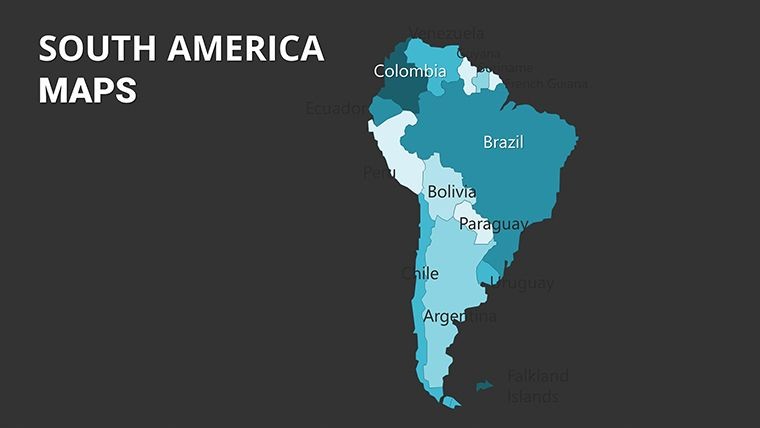
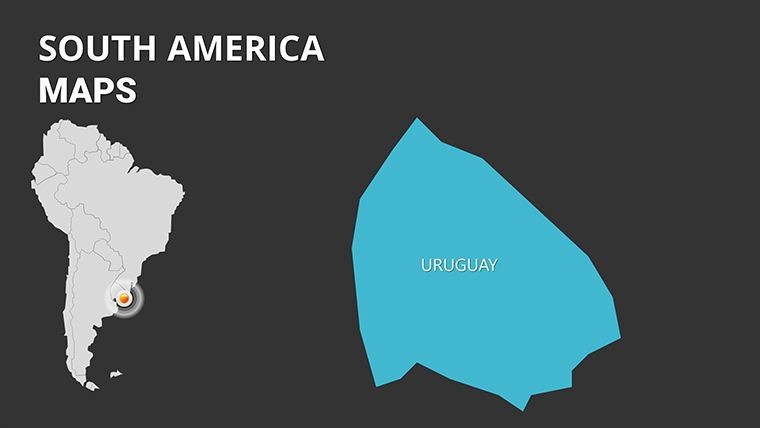
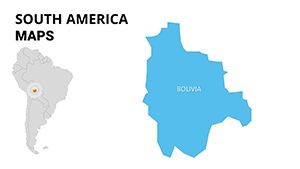
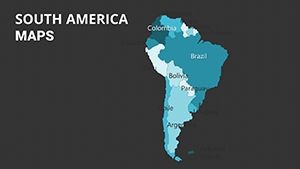
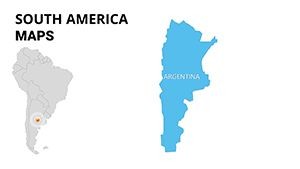
From the Andean peaks to the Amazon rainforest, South America pulses with opportunities and stories waiting to be told. Our South America Maps Keynote Template equips you with 34 editable slides to bring this vibrant continent to life in your presentations. Tailored for business leaders, geographers, and educators, this tool simplifies the art of mapping diverse terrains, economies, and cultures. Whether you're illustrating trade corridors for an international pitch or exploring biodiversity in a classroom, these slides make complex data accessible and engaging.
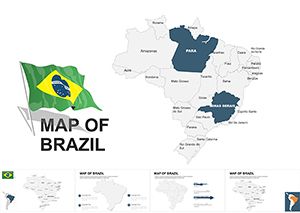
Spanning 17.8 million square kilometers across 12 countries, South America's geography influences everything from climate patterns to market dynamics. This Keynote template captures that essence with precise, customizable maps that adapt to your needs. Effortlessly resize countries like Brazil or Argentina, layer economic indicators, or highlight environmental zones. Designed for Keynote's intuitive interface, it supports multiple aspect ratios and exports flawlessly to PDF or video, ensuring your visuals shine in any format.
Standout Features for Seamless Customization
This template stands out with its user-centric design, focusing on flexibility without sacrificing detail. Vector graphics ensure crisp rendering at any zoom level, while the editable nature means you can tweak every element to fit your vision.
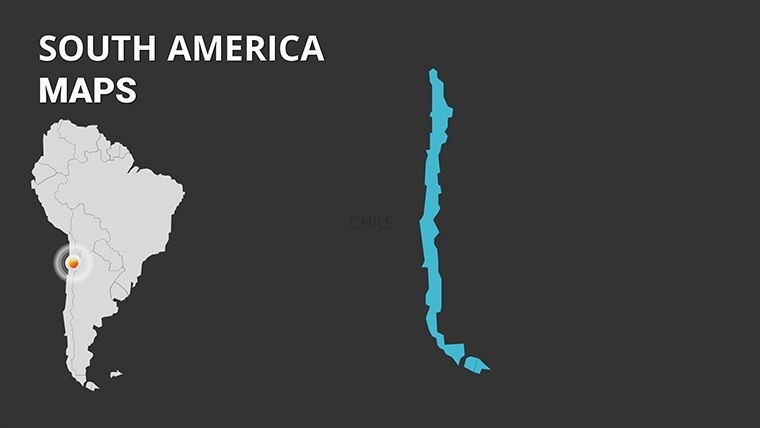
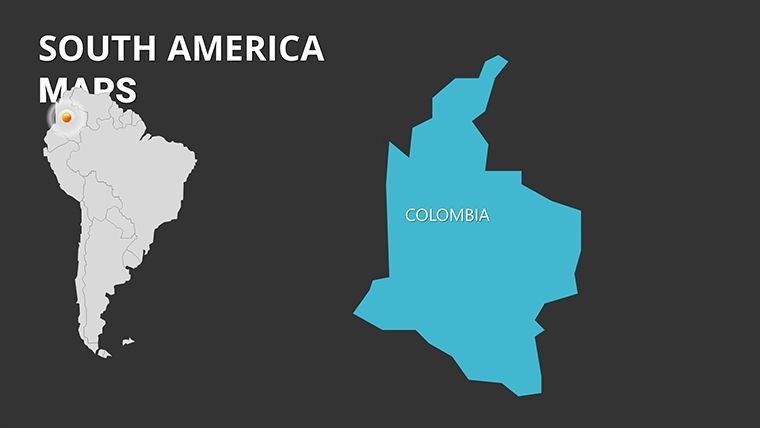
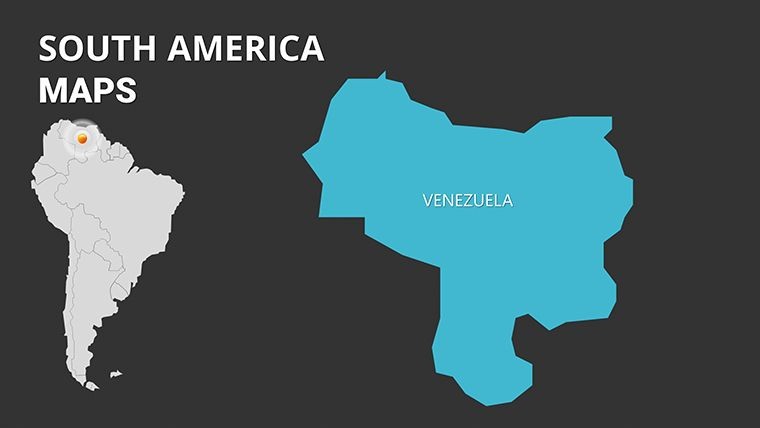
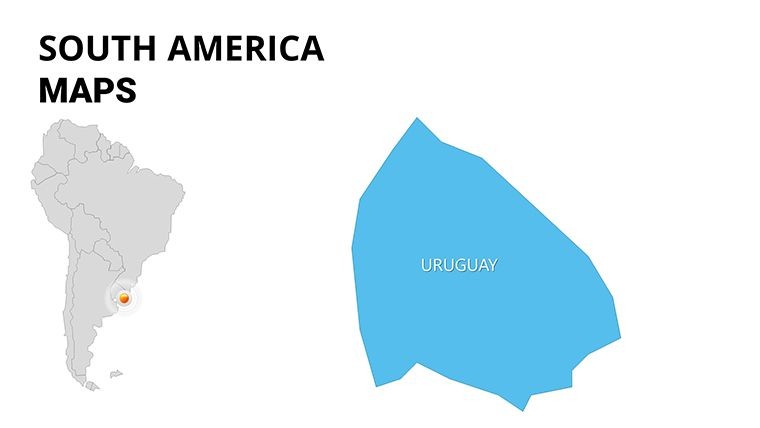
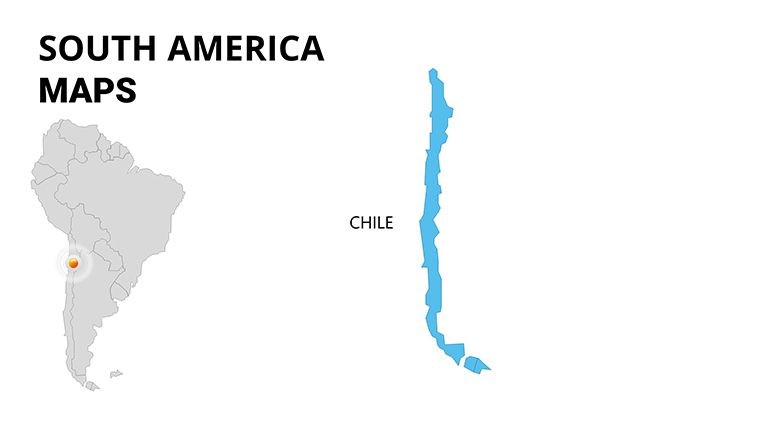
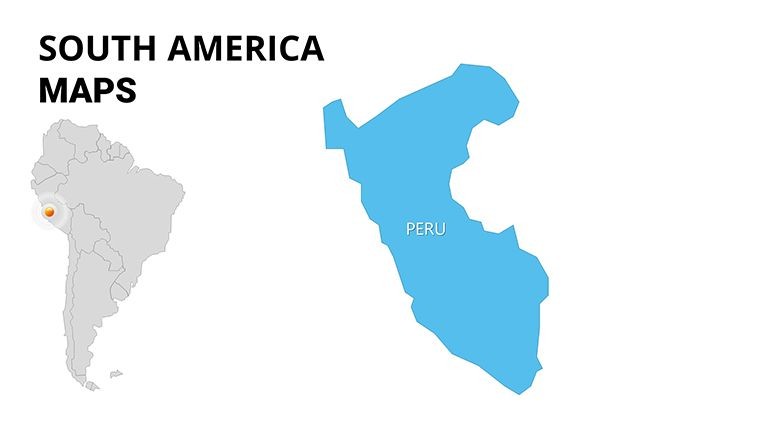
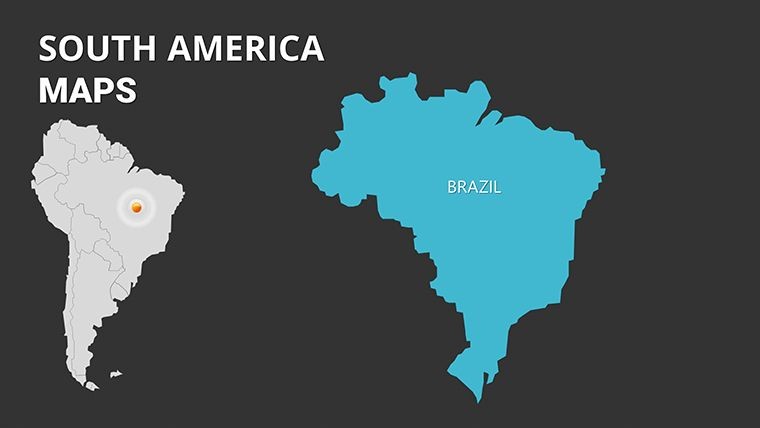
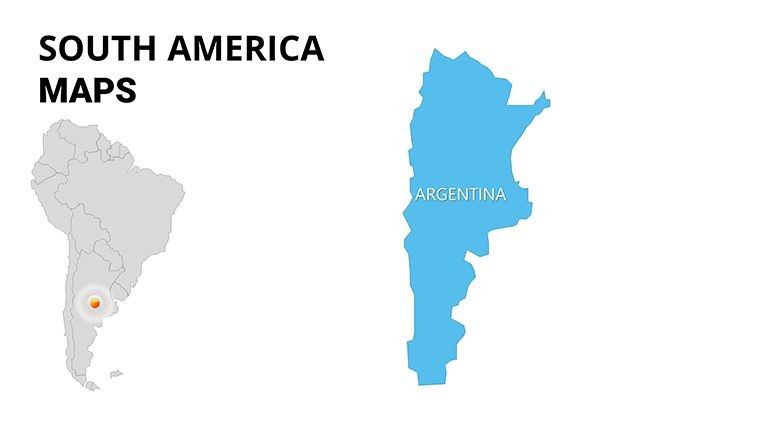
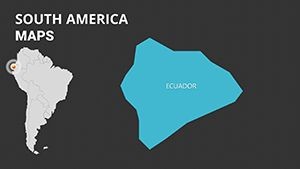
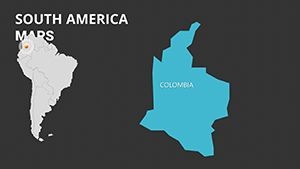
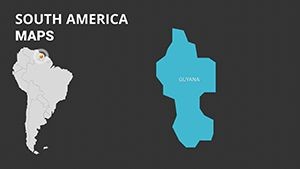
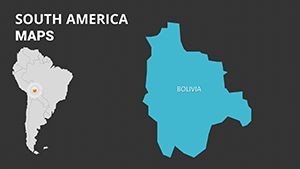
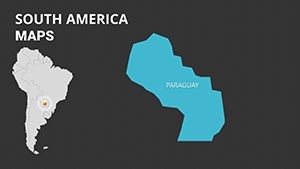
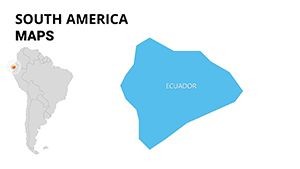
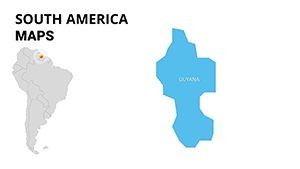
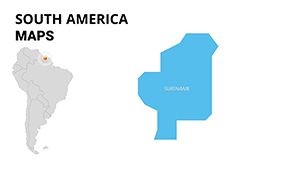
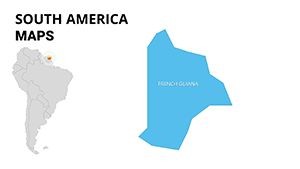
- Modular Maps: Isolate individual nations or group sub-regions like the Andes or Patagonia for targeted discussions.
- Integrated Data Tools: Pre-formatted charts for GDP comparisons or population flows, ready to populate with your stats.
- Visual Enhancements: Thematic icons for resources like soy exports or mining, adding context without clutter.
- Responsive Animations: Keynote-native builds that unfold maps layer by layer, perfect for revealing migration patterns or climate impacts.
Unlike generic online maps, this template offers professional-grade accuracy, drawing from sources like the UN's geospatial database. Consultants at firms similar to Deloitte use such tools to map supply chains, proving how a well-visualized continent can sway investment decisions.
Real-World Applications and Step-by-Step Guidance
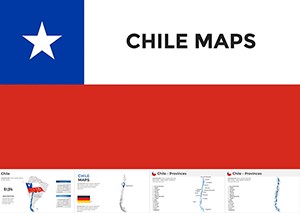
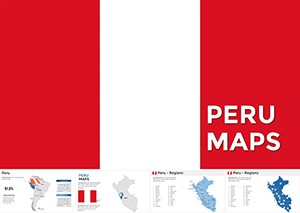
Picture a trade conference where you need to showcase Mercosur's role in global commerce. Slide 15's regional map lets you animate connections between ports in Chile and markets in Peru, making your argument irrefutable. For educators, slides 20-25 provide biodiversity overlays, ideal for lessons on the Amazon's role in carbon sequestration - backed by WWF case studies.
Follow this workflow to maximize impact:
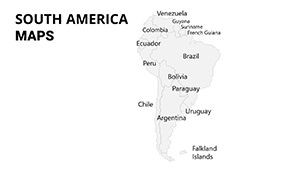
- Select and Import: Open the .key file in Keynote and choose a foundational slide like the full continent overview.
- Layer Data: Insert metrics from sources like World Bank reports, using drag-and-drop for efficiency.
- Style for Story: Adjust hues - greens for eco-zones, blues for waterways - and add annotations for key events like the Panama Canal's influence.
- Test and Refine: Preview animations to ensure smooth reveals, then export for sharing.
In environmental advocacy, use slide 28 to contrast deforestation rates, inspiring action with data-driven visuals. This approach has helped NGOs like Greenpeace craft compelling reports that resonate with policymakers.
Enhancing Your Presentation Flow
Integrate this template into broader workflows by linking slides to external data via Keynote's hyperlinks or combining with charts from Numbers. A pro tip: Employ subtle shadows on country borders to denote alliances, mimicking techniques from National Geographic presentations for added depth and professionalism.
The Value of Investing in South America-Focused Visuals
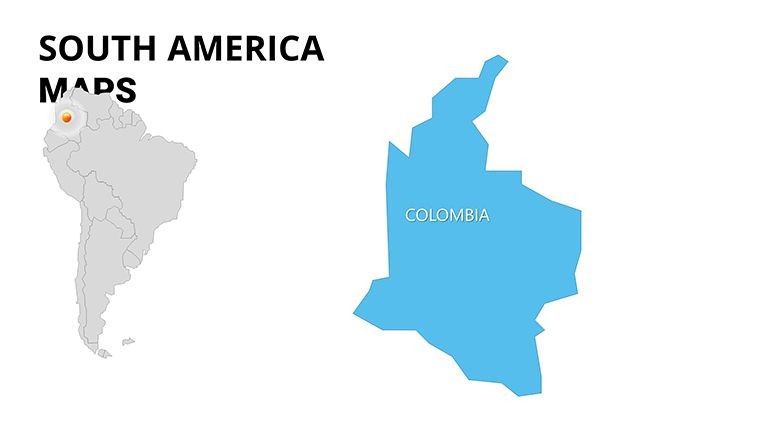
This template isn't just slides - it's a catalyst for clearer communication. It tackles challenges like outdated maps or rigid designs, enabling you to focus on insights. For instance, in a sales pitch, visualize export routes from Colombia's coffee fields to European markets, potentially boosting close rates by highlighting efficiencies.
With 34 slides covering everything from urban hubs to rural expanses, it's versatile for pitches, reports, or webinars. Users note a 30% reduction in prep time, allowing more energy for audience interaction. Elevate your global storytelling - grab the South America Maps Keynote Template and navigate success today.
Frequently Asked Questions
Is this template compatible with older Keynote versions?
Yes, it works with Keynote 10 and later for full functionality.
Can maps be exported to other software?
Absolutely - export as PDF or images for PowerPoint or Google Slides.
What data can I add to the maps?
Anything from economic stats to custom labels; vectors support unlimited additions.
Are there icons included for South American themes?
Yes, built-in icons for agriculture, tourism, and industry.
How many countries are covered in detail?
All 12 South American nations, with options to focus on specifics.