Customizable Middle East Maps Keynote Template: Charting Regional Dynamics


Type: Keynote Maps template
Category: Middle East, Asia
Sources Available: .key
Product ID: KM00049
Template incl.: 44 editable slides
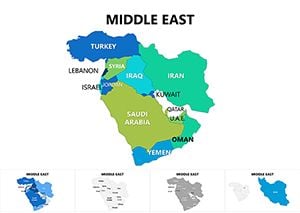
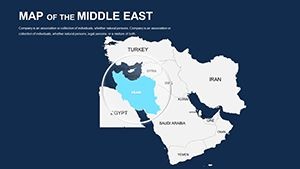
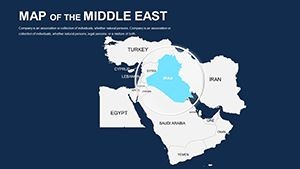
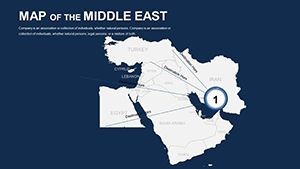
Navigating the intricate web of the Middle East's geopolitics, trade routes, and cultural crossroads demands visuals that are as dynamic as the region itself. Our Customizable Middle East Maps Keynote Template delivers exactly that, with 44 meticulously crafted, editable slides ready to bring your insights to life. Aimed at international relations experts, energy sector analysts, and history educators, this template bridges the gap between complex data and compelling storytelling. Picture illustrating Saudi Arabia's oil dominance or Egypt's Nile Valley heritage with precision maps that engage rather than overwhelm.
Rooted in reliable sources like the United Nations' geographic frameworks, this tool ensures factual accuracy while offering boundless customization. In an era of global connectivity, where decisions on trade pacts or conflict resolutions rely on clear spatial understanding, this template empowers you to stand out. Consultants at firms like McKinsey have harnessed similar assets to map supply chains across the Gulf, clinching partnerships worth billions. For teachers, it's a vibrant aid for lessons on ancient civilizations from Mesopotamia to modern Dubai's skyscrapers. Keynote's native support means fluid edits and animations that keep your presentation polished and professional.
Standout Features for Strategic Presentations
Designed by seasoned Keynote specialists, this template prioritizes efficiency and impact. Vector graphics guarantee crisp details at any zoom, and modular layers let you toggle elements effortlessly. Explore the core strengths:
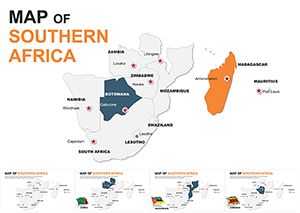
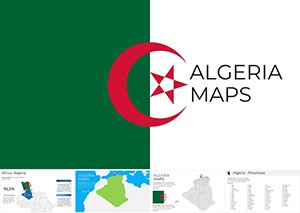
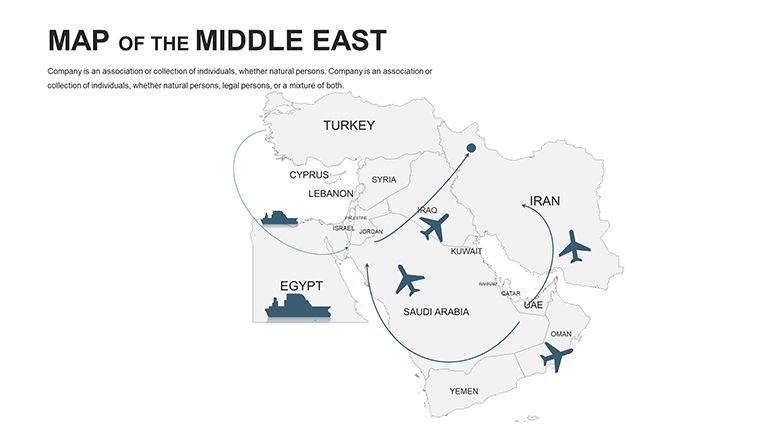
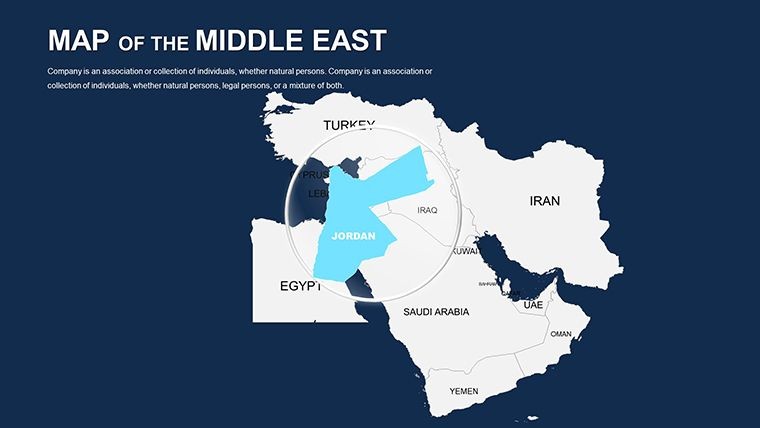
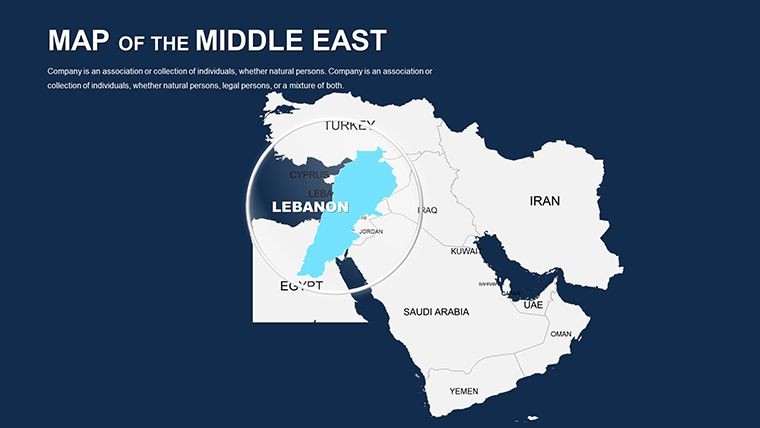
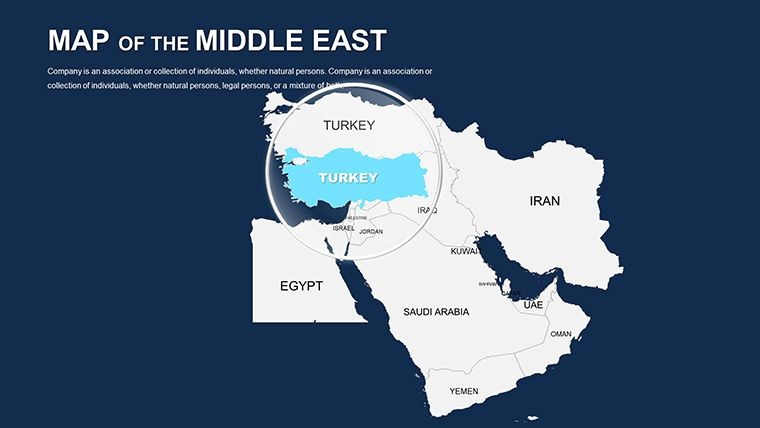
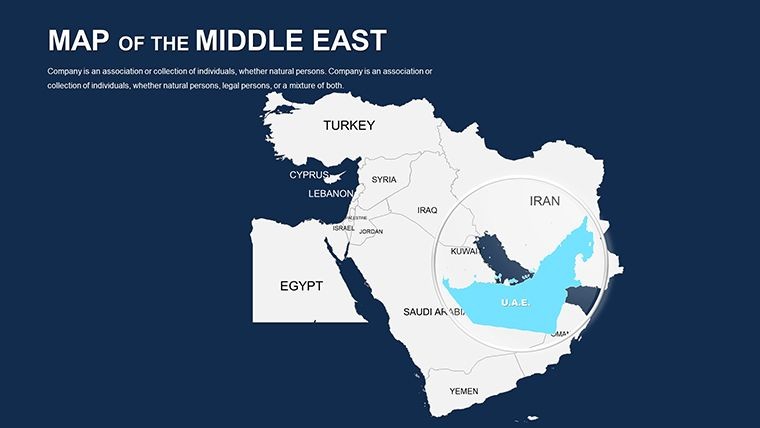
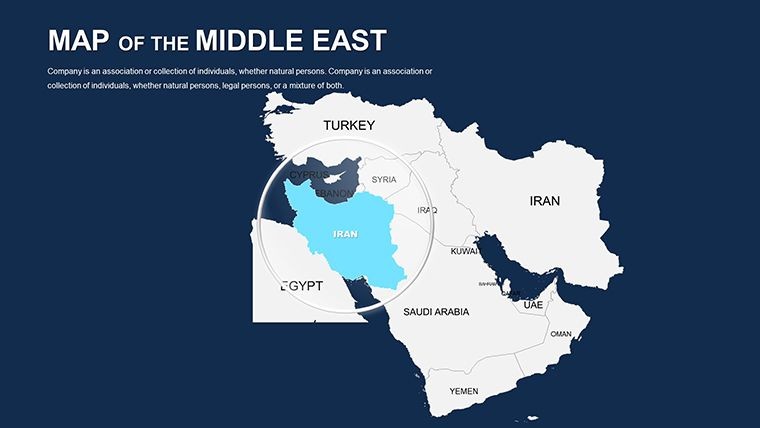
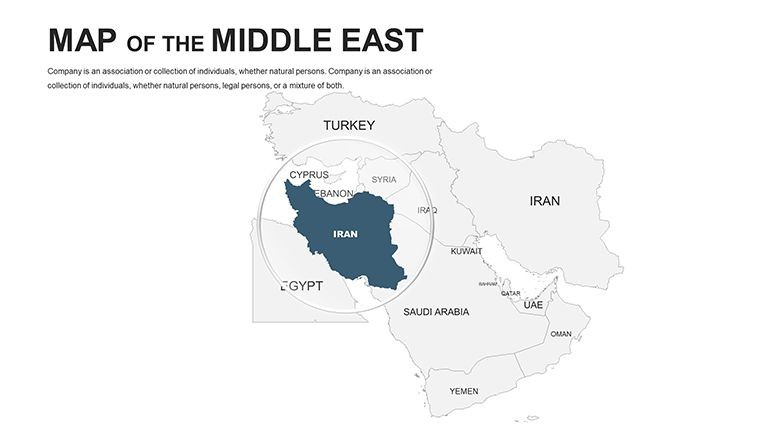
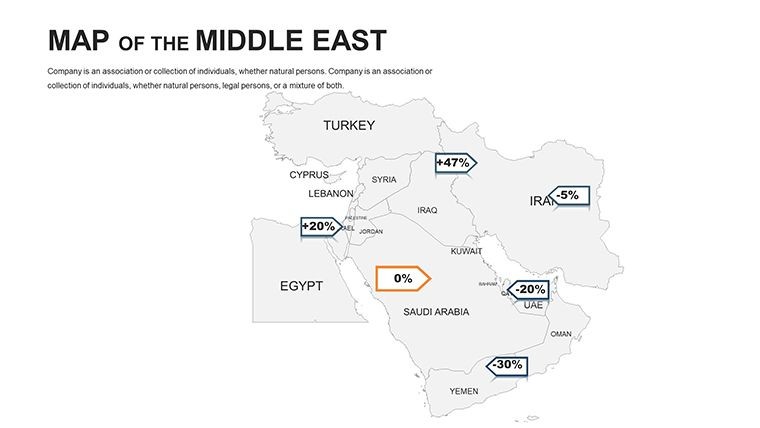
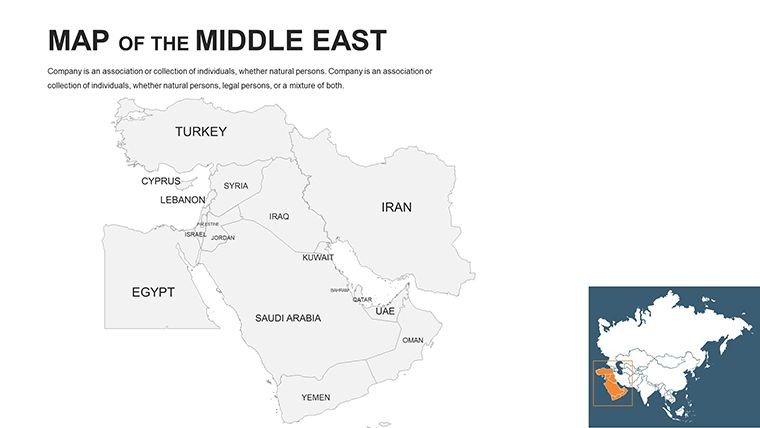
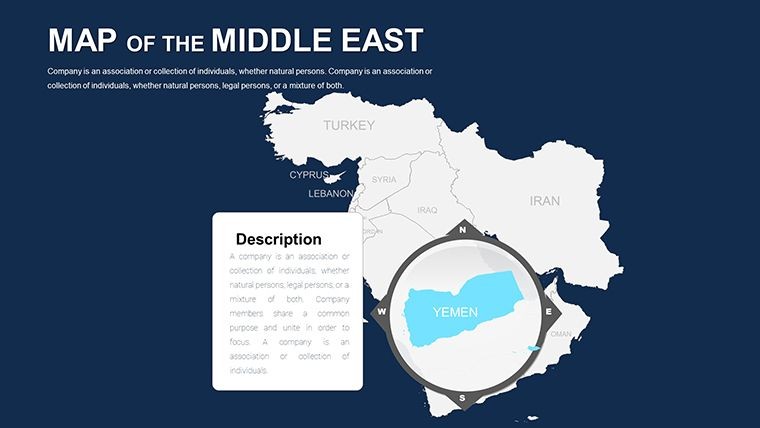
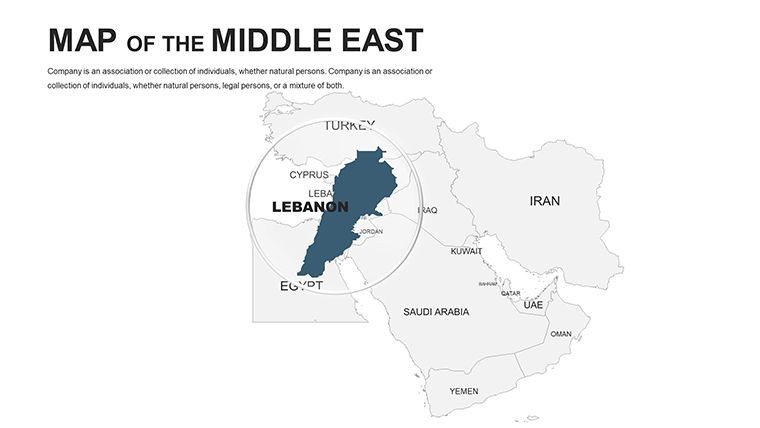
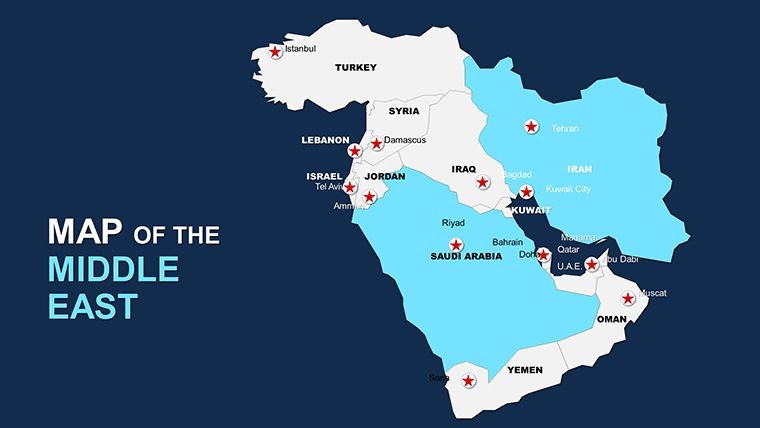
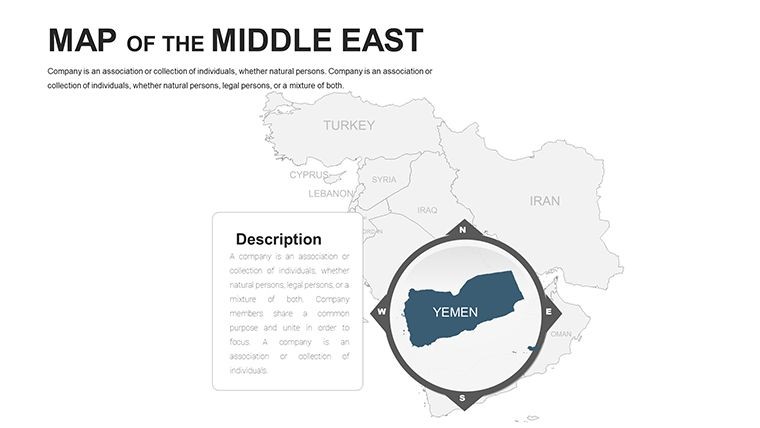
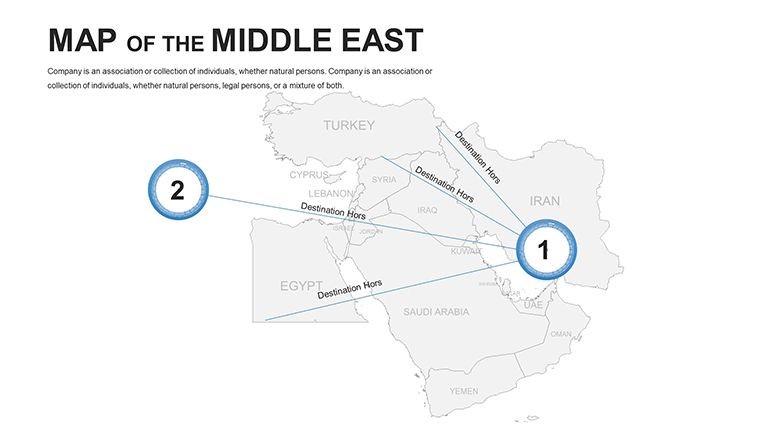
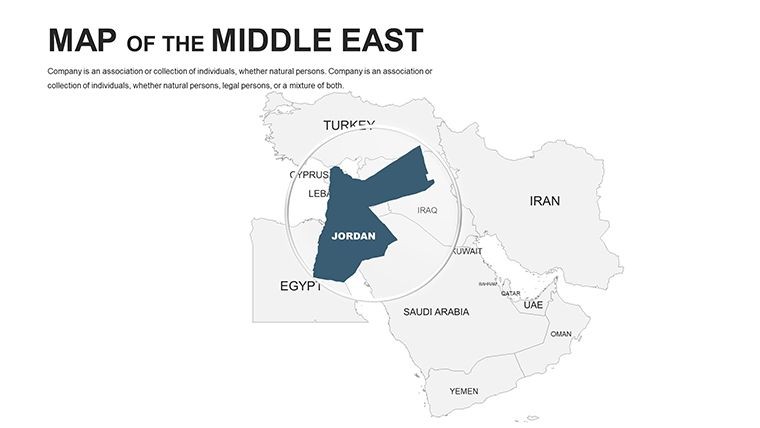
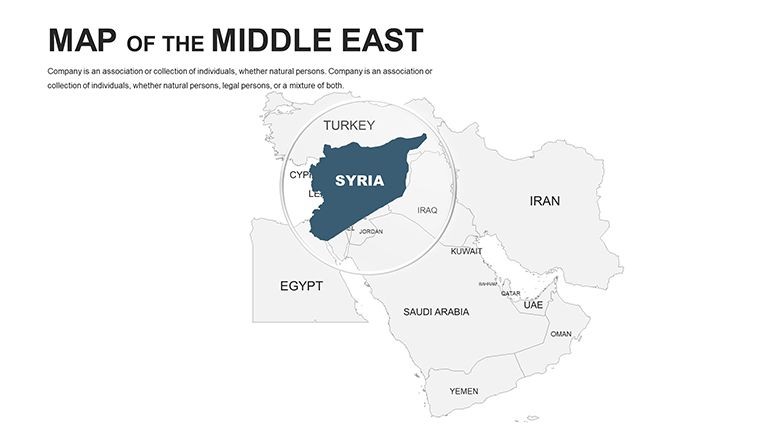
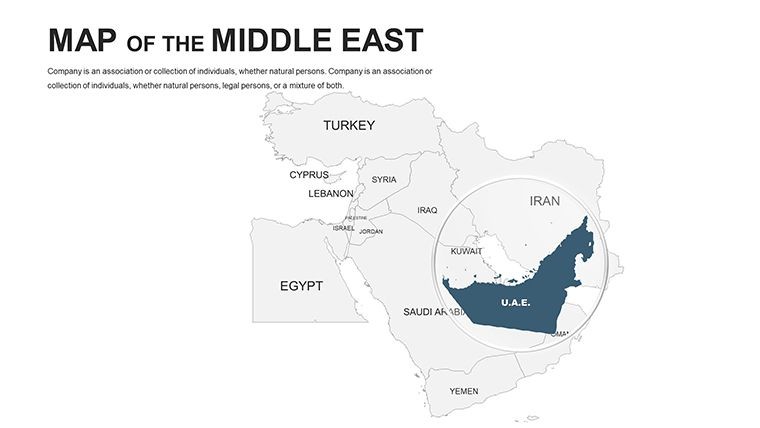
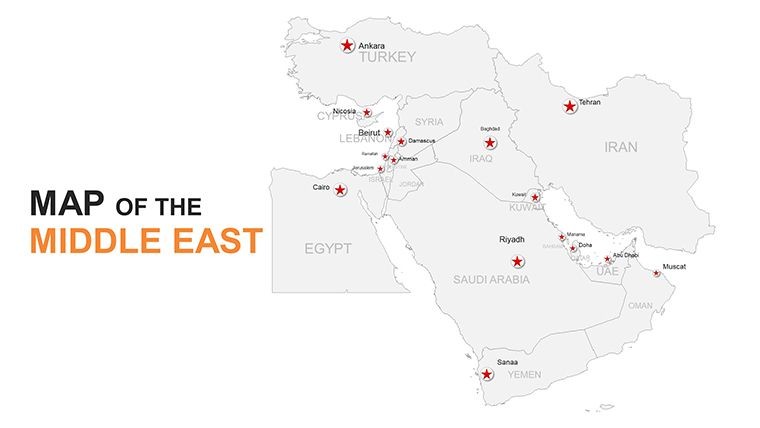
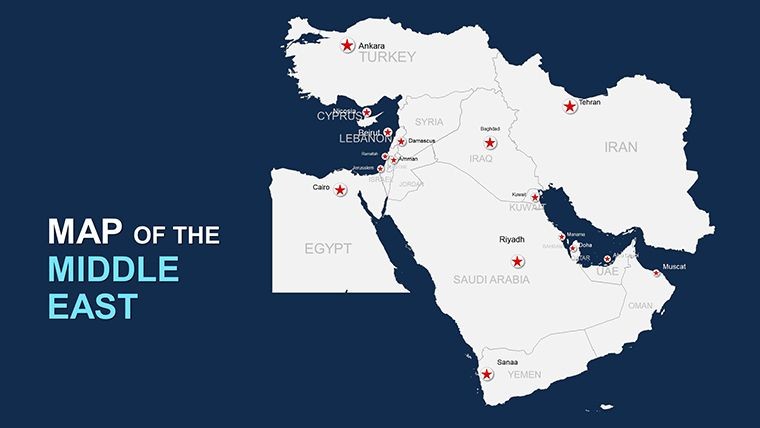
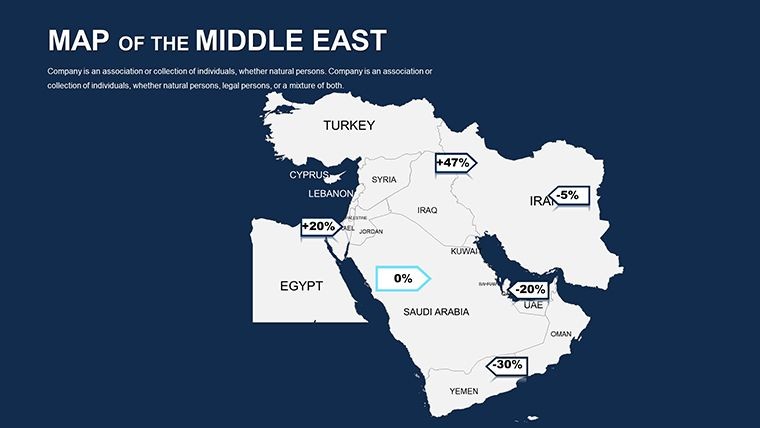
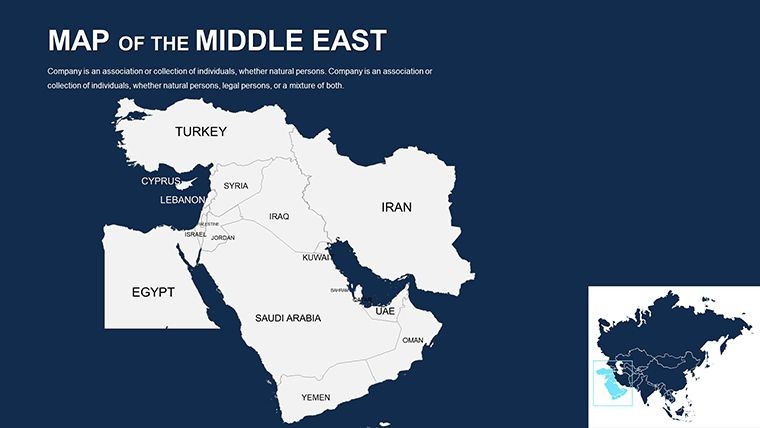
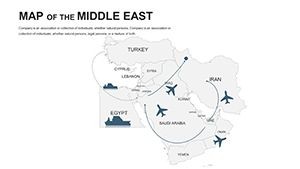
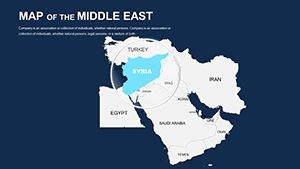
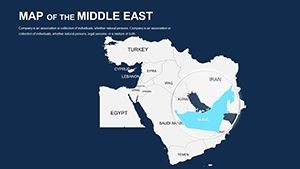
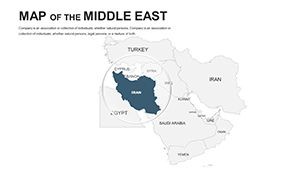
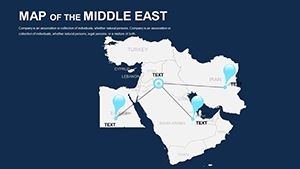
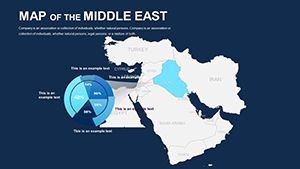
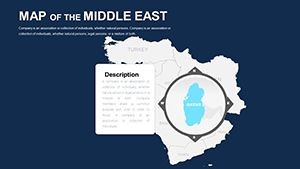
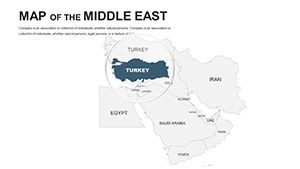
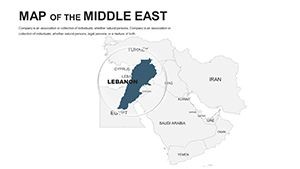
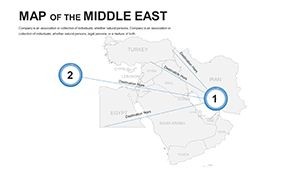
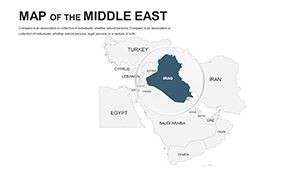
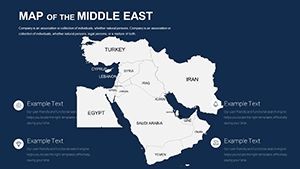
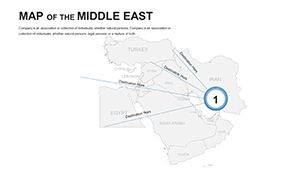
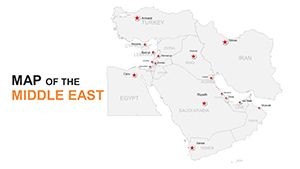
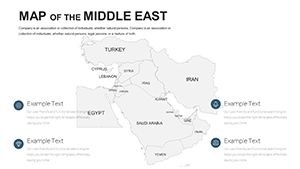
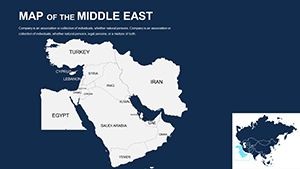
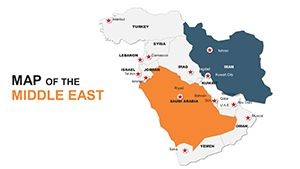
- Diverse Regional Coverage: Political maps delineating 18 countries, from Turkey's Anatolian plains to Yemen's rugged terrains, plus physical features like the Arabian Desert and Tigris-Euphrates rivers.
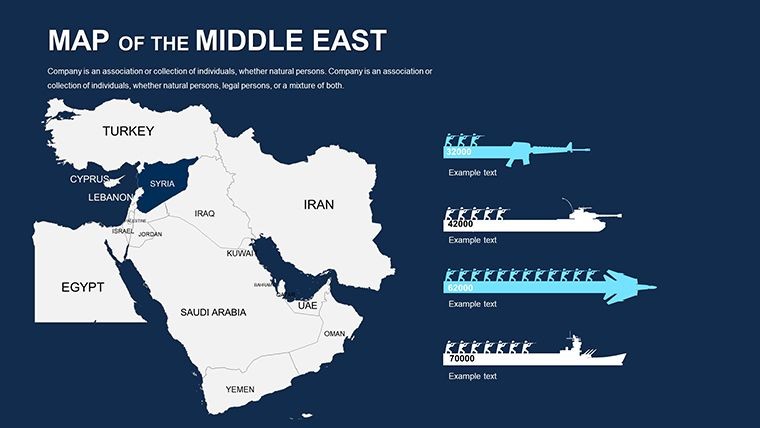
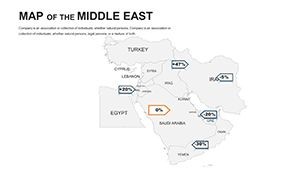
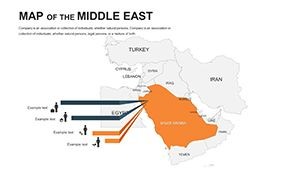
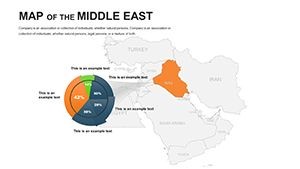
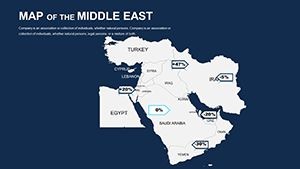
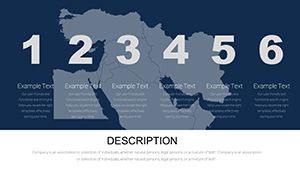
- Interactive Data Integration: Layer in economic indicators - bar graphs for GDP per capita or flow charts for migration patterns. Animate reveals to spotlight key areas, enhancing narrative flow.
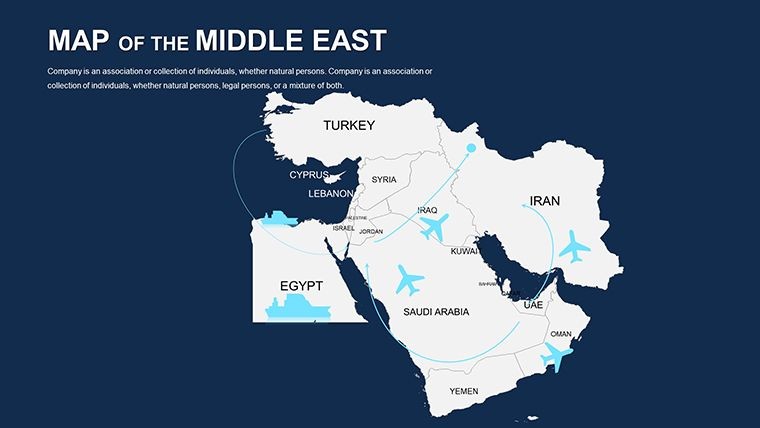
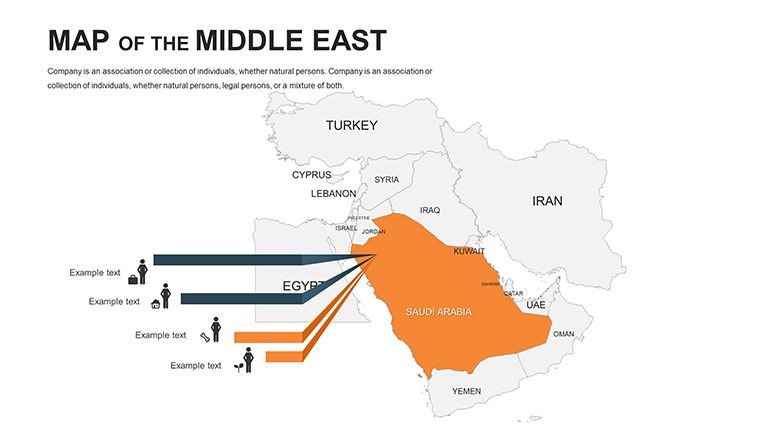
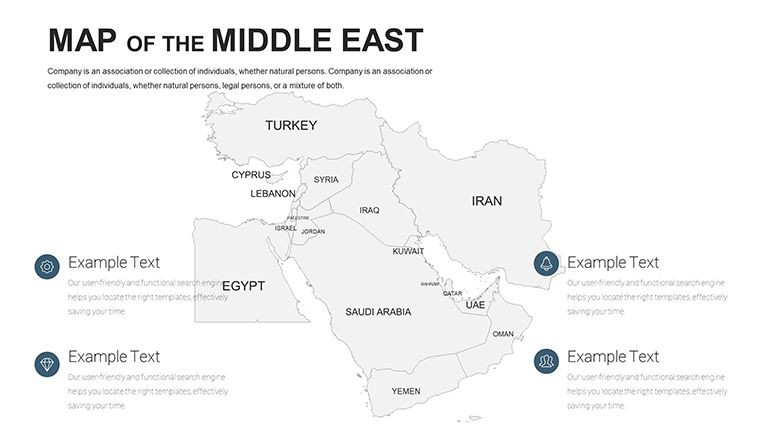
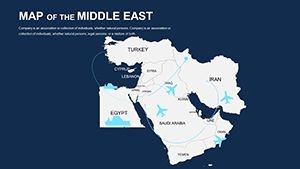
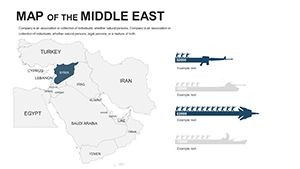
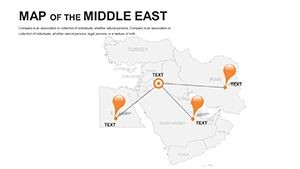
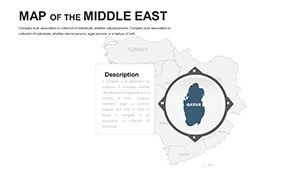
- Rich Icon Library: 60+ symbols for oil rigs, mosques, and trade ships, all scalable and theme-adjustable. Incorporate flags and emblems for authentic cultural representation.
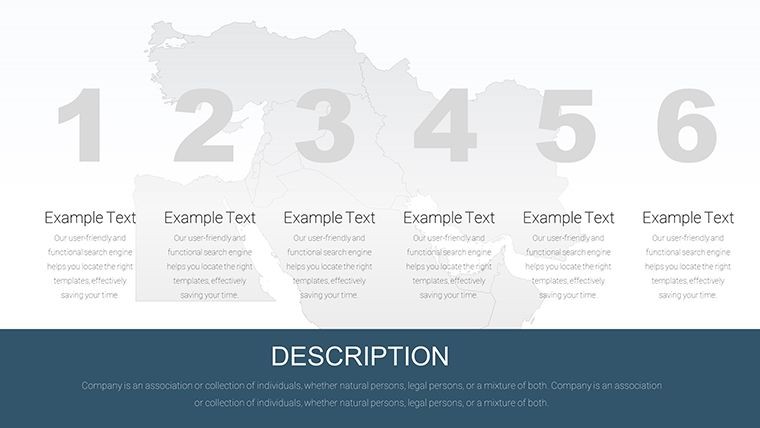
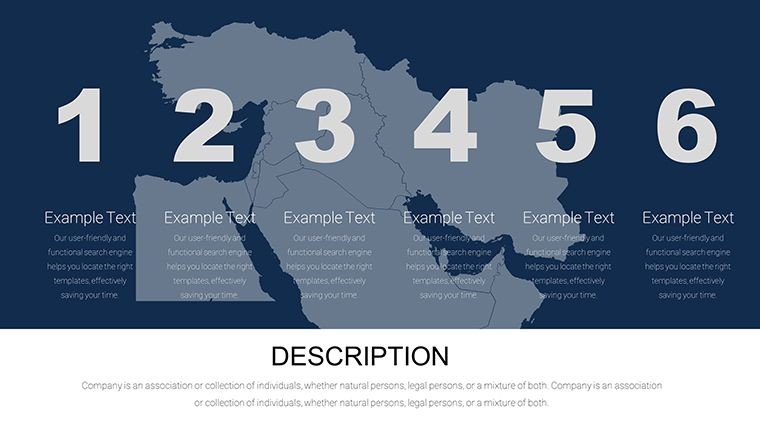
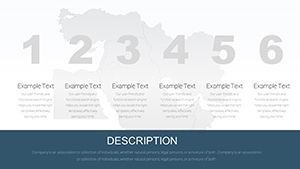
- Versatile Slide Set: 44 layouts including timeline views of historical events, comparative overlays for resource distribution, and customizable blanks for bespoke content.
Versus standard mapping software, this shines with Keynote-specific optimizations like hyper-smooth transitions and compact file handling, ideal for iPad presentations. It's more than slides - it's a canvas for geopolitical mastery.
Navigating the Slides: A Detailed Guide
Begin with Slides 1-12: Core political outlines, editable to highlight alliances like the GCC. Add data from OPEC reports to visualize energy exports, as in real pitches for renewable transitions in the UAE. Slides 13-24 delve into physical geography - customize wadis and oases to discuss water scarcity, informed by World Bank climate studies.
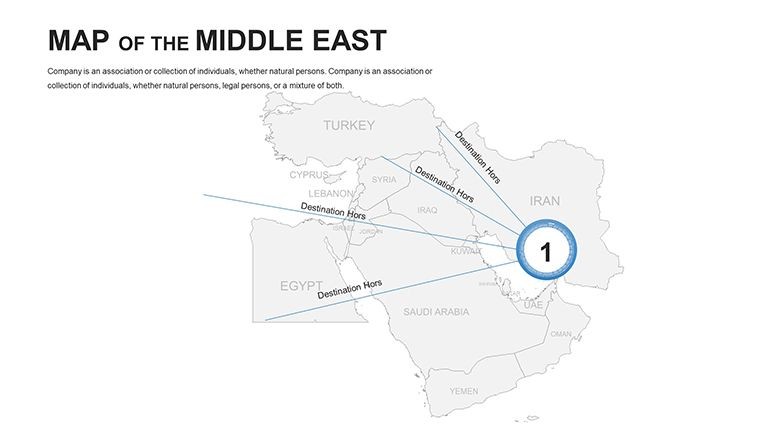
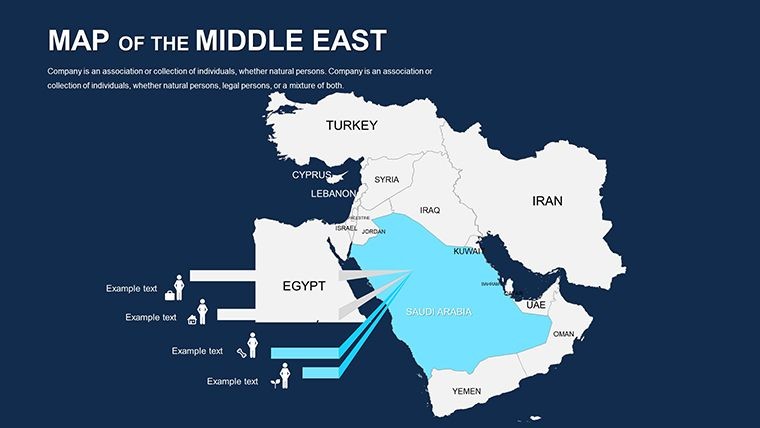
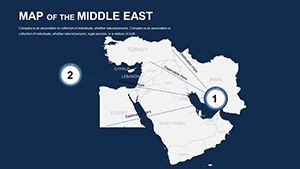
Slides 25-35 offer thematic depth: Population heat maps tracking urban booms in Istanbul or Riyadh, useful for demographic forecasts in policy briefs. Conclude with Slides 36-44: Route maps for Silk Road revivals or economic corridor infographics, drawing from Belt and Road Initiative examples. This progression builds a cohesive story, from context to conclusion.
Practical Use Cases: Powering Insights
Unlock the template's potential across scenarios. In business, delineate trade hubs in the Strait of Hormuz for logistics strategies, mirroring successes in ADNOC's expansion plans. Educators can animate historical migrations, making Ottoman Empire lessons immersive and memorable.
Workflow integration is straightforward: Import geospatial data from GIS tools into Keynote, recolor for accessibility (e.g., high-contrast for diverse audiences), apply builds to unveil layers sequentially, and rehearse with presenter's notes. Pro tip: Pair with Keynote's magic move for fluid map zooms, simulating a virtual tour of the Levant.
A compelling case: A think tank in Washington used akin templates to brief on Syrian refugee flows, influencing aid allocations through vivid spatial narratives. Such applications highlight how this tool fosters informed dialogue in volatile regions.
Advantages Over Conventional Options
Free alternatives often suffer from rigid formats; here, full editability includes text paths along borders for labels. Accessibility features like semantic markup aid screen readers, while RTL support accommodates Arabic scripts. Link slides to external analytics dashboards for live updates during virtual conferences.
For teams, collaborative editing via iCloud ensures version control. The outcome: Presentations that drive strategy, from boardrooms to lecture halls.
Expert Customization Strategies
- Element Grouping: Cluster cities and pipelines for selective visibility - streamline focus on energy sectors.
- Animation Sequencing: Stagger fades for country intros, building geopolitical tension dramatically.
- Theme Alignment: Adapt palettes to sandy neutrals or vibrant souks, syncing with your deck's mood.
- Engagement Boost: Embed QR codes on slides linking to deeper resources like Al Jazeera reports.
These techniques, aligned with Apple's design ethos, amplify your message's resonance. Let the Middle East's map guide your audience through its complexities.
Seize the opportunity - Acquire the Customizable Middle East Maps Keynote Template today and navigate narratives with confidence. Transform insights into influence, one slide at a time.
Frequently Asked Questions
Is this template suitable for geopolitical analysis?
Yes, with accurate borders and editable layers, it's ideal for mapping conflicts, alliances, and resource flows.
How do animations enhance the maps?
Keynote's built-in tools allow smooth transitions, like revealing trade routes progressively to maintain interest.
Can I add my own data sources?
Absolutely - import from CSV or copy-paste stats directly into editable charts and labels.
What file formats are provided?
Native .key files, plus vectors and PNGs for broader compatibility if needed.
Is it optimized for educational use?
Definitely, with clear visuals and customization for interactive classroom activities on history or geography.
Does it cover all Middle East countries?
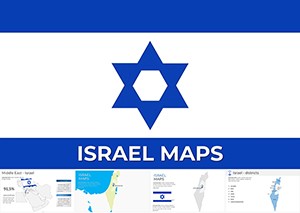
Yes, 44 slides encompass 18 nations, from Iran to Israel, with thematic extensions.