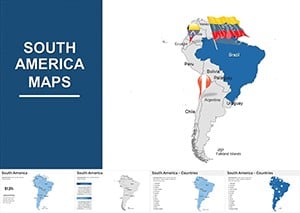
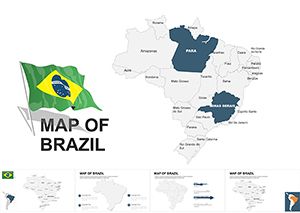
Customizable Brazil Keynote Maps Template: Explore Geography and Economy


Type: Keynote Maps template
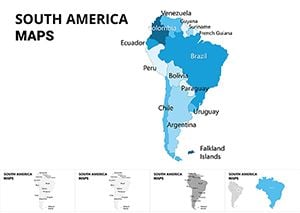
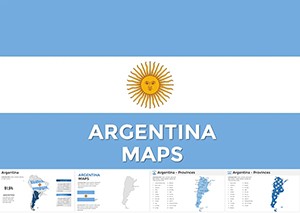
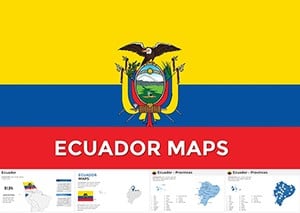
Category: South America
Sources Available: .key
Product ID: KM00028
Template incl.: 36 editable slides
Brazil's vast landscapes, from the Amazon's lush rainforests to the bustling metropolises like São Paulo, demand visuals that capture their scale and significance. Our Customizable Brazil Keynote Maps Template delivers just that, with 36 editable slides tailored for those who need to present on this South American giant. Whether you're a business leader outlining agribusiness opportunities, an environmental scientist discussing biodiversity, or a teacher covering natural resources, this template provides the canvas to paint vivid pictures. It addresses pain points like outdated maps or inflexible designs by offering up-to-date, vector-based elements compatible with Keynote, PowerPoint, and Google Slides. Drawing from authoritative sources such as IBGE (Brazilian Institute of Geography and Statistics), it ensures accuracy while allowing creative flair - think of it as your shortcut to presentations that echo the dynamism of Brazil's economy, much like those used in World Bank reports on sustainable development. With this tool, turn data on cultivated lands and water resources into engaging stories that inform and inspire your audience.
Core Features Driving Visual Excellence
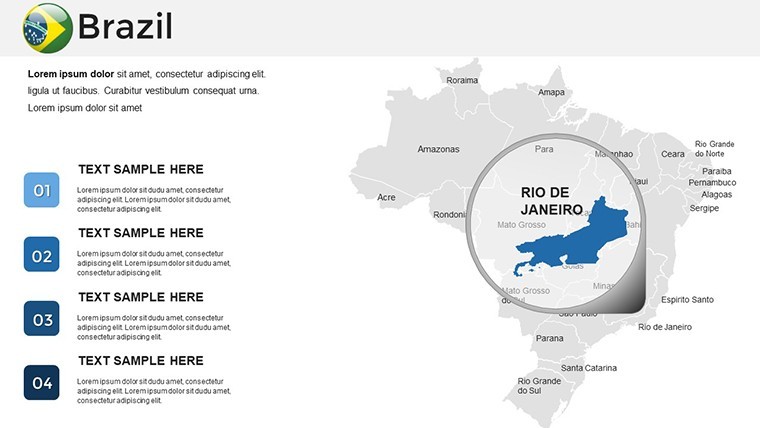
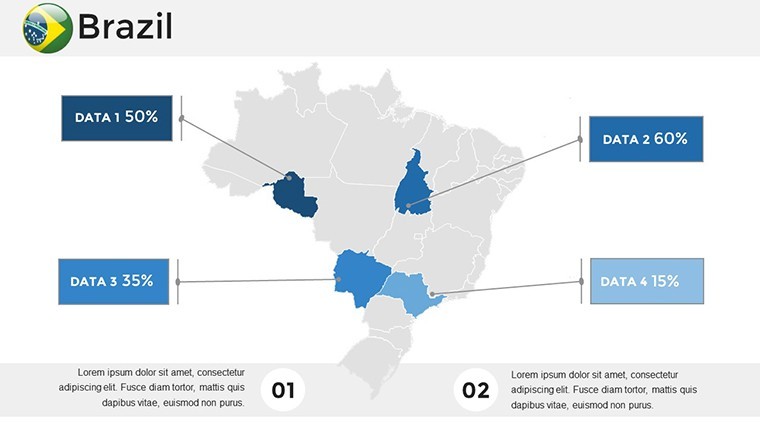
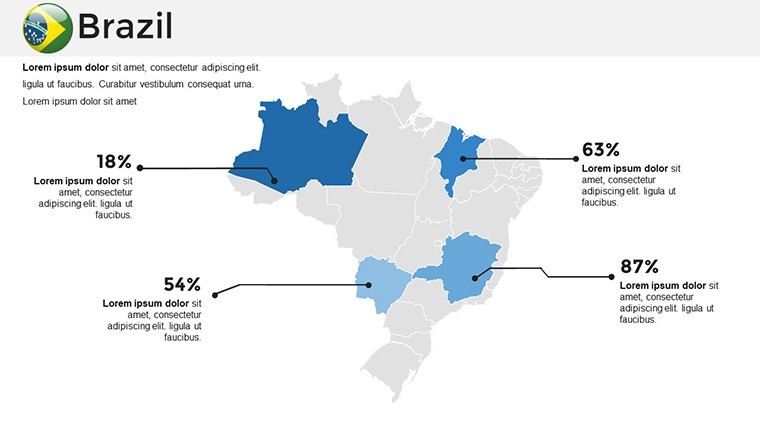
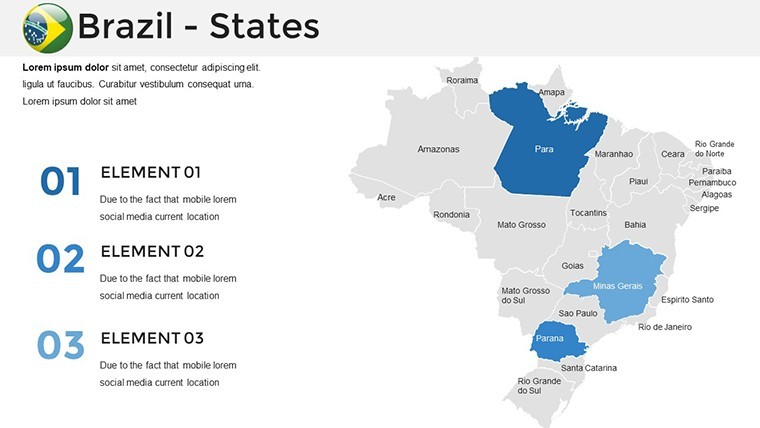
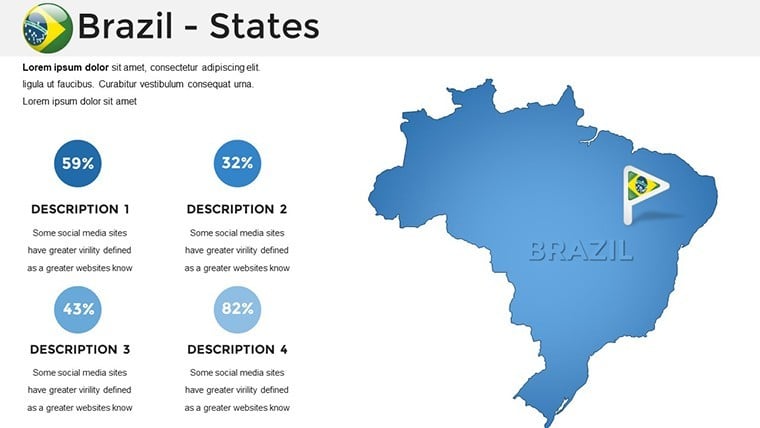
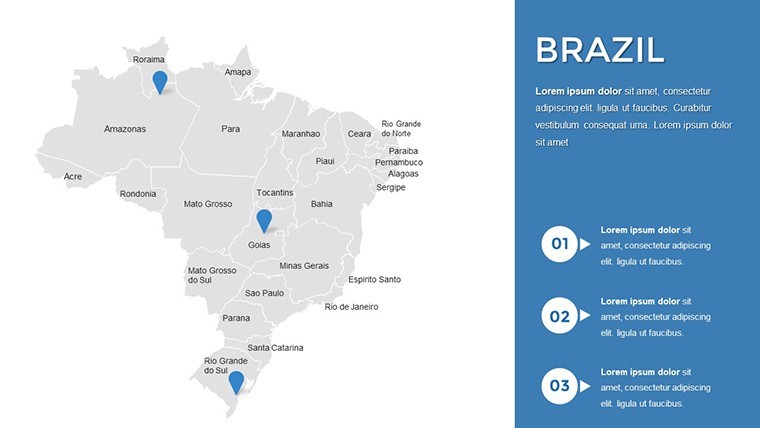
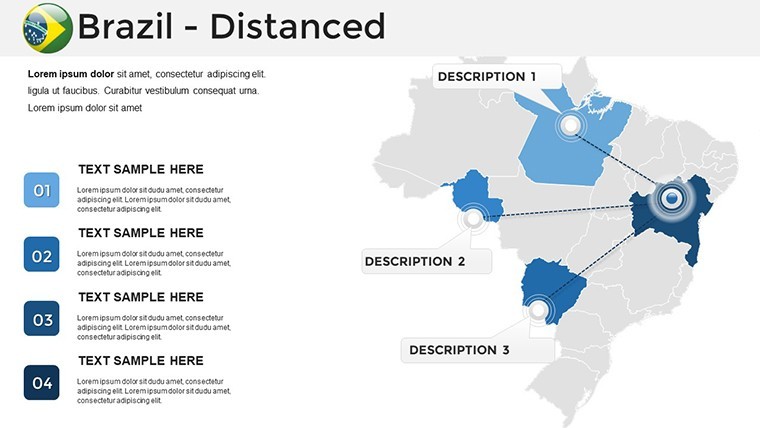
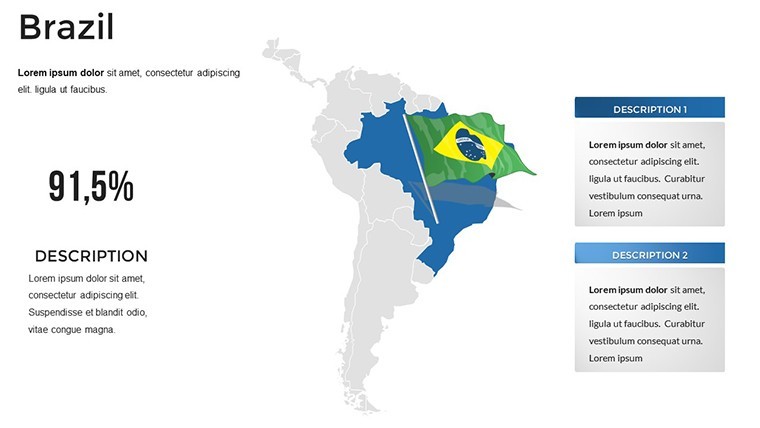
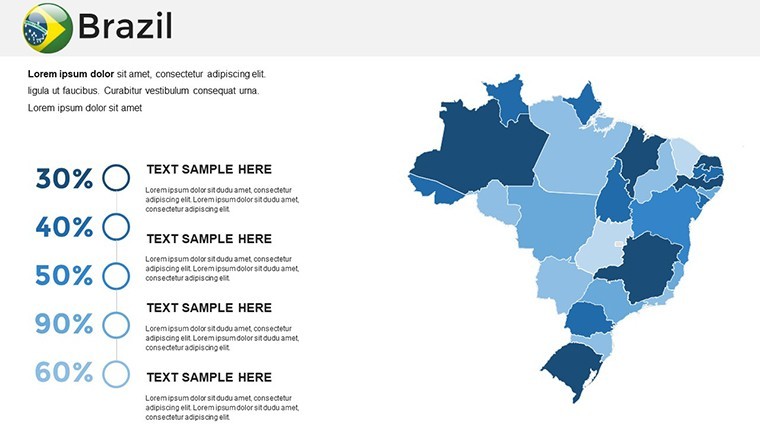
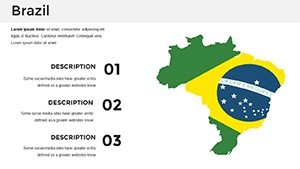
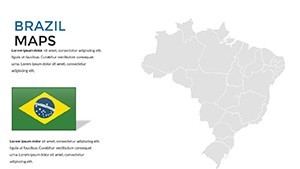
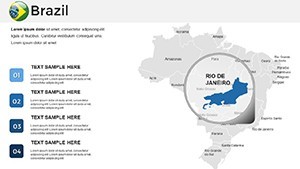
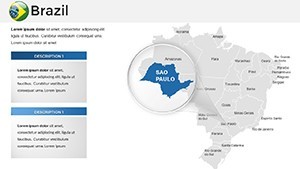
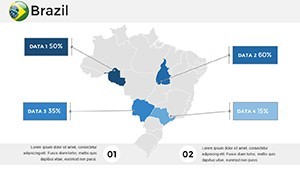
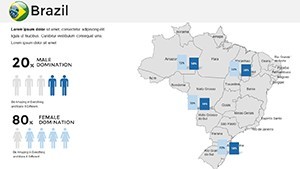
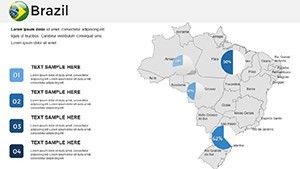
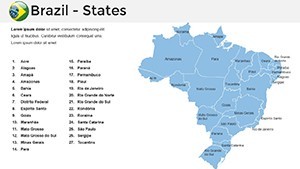
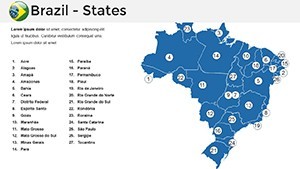
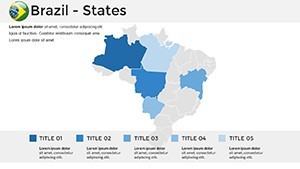
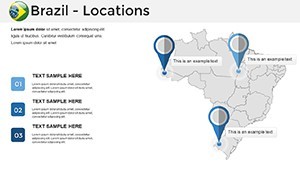
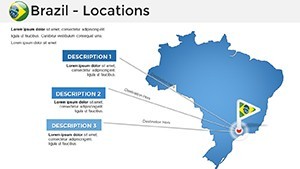
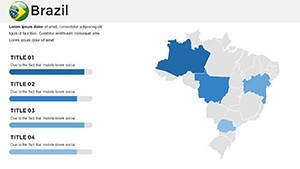
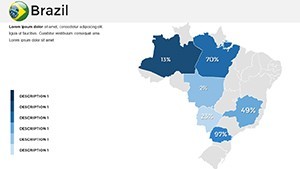
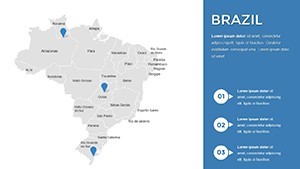
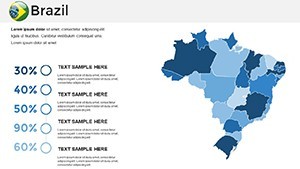
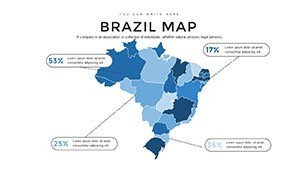
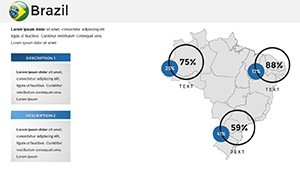
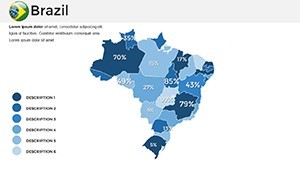
The template's foundation is its editable maps, featuring detailed outlines of Brazil's 26 states and federal district, with layers for rivers like the Amazon and forest belts. Vector icons represent economic hubs, allowing color changes to denote sectors - greens for agriculture, blues for hydropower. This setup facilitates quick adaptations, such as highlighting deforestation trends with overlaid timelines.
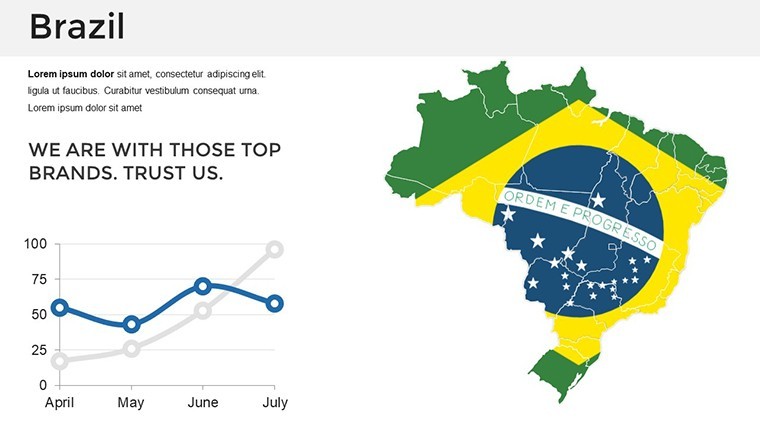
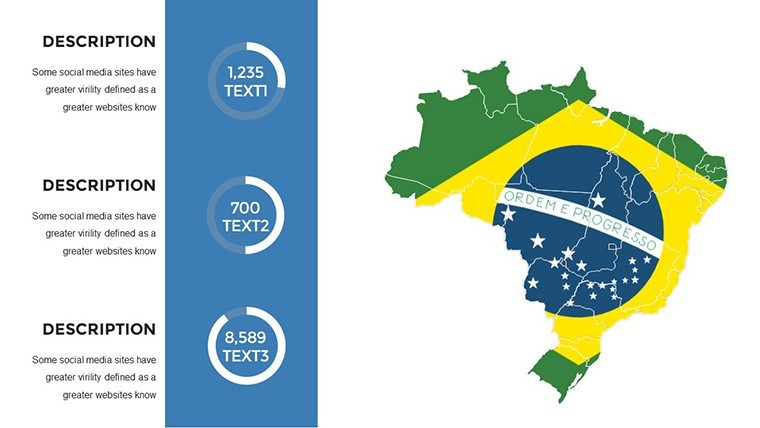
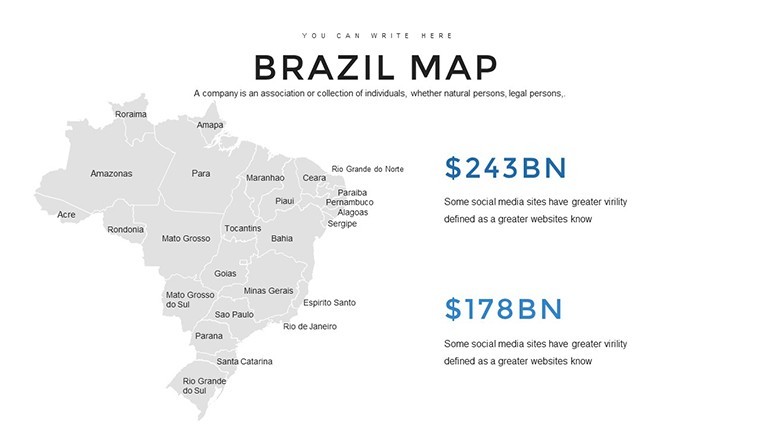
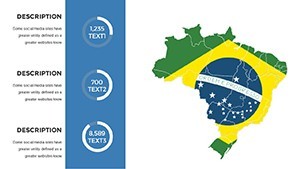
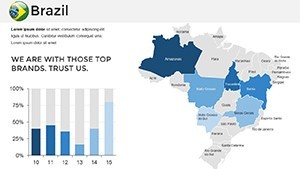
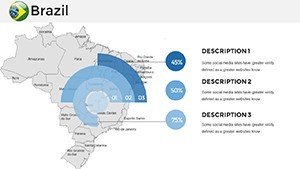
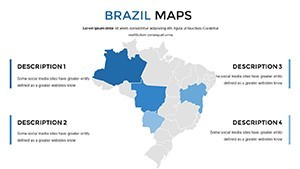
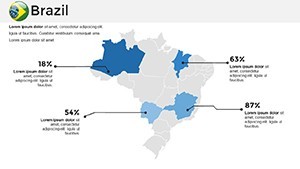
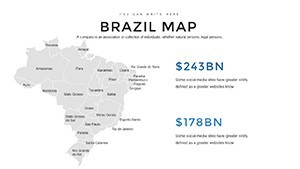
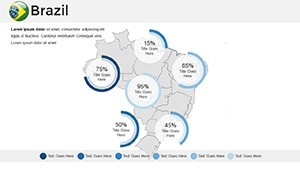
Included are infographic slides for economic metrics, like bar charts for GDP contributions from soy exports or pie charts for energy sources. All elements are fully modifiable, supporting animations for revealing regional developments progressively. This mirrors professional standards from organizations like the Brazilian Geographical Society, ensuring your slides are both informative and aesthetically pleasing.
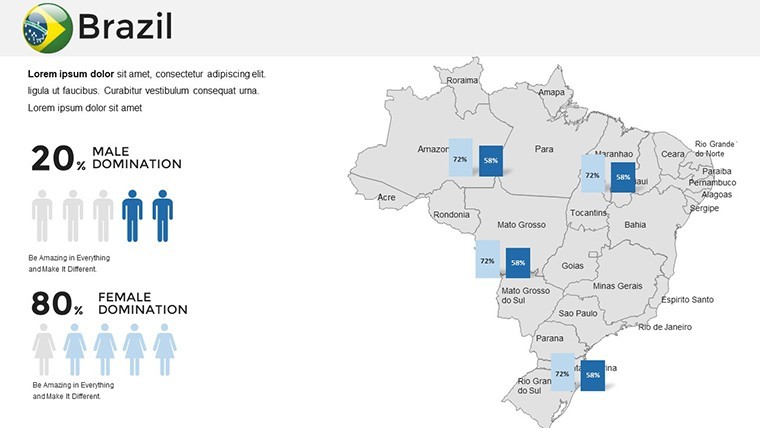
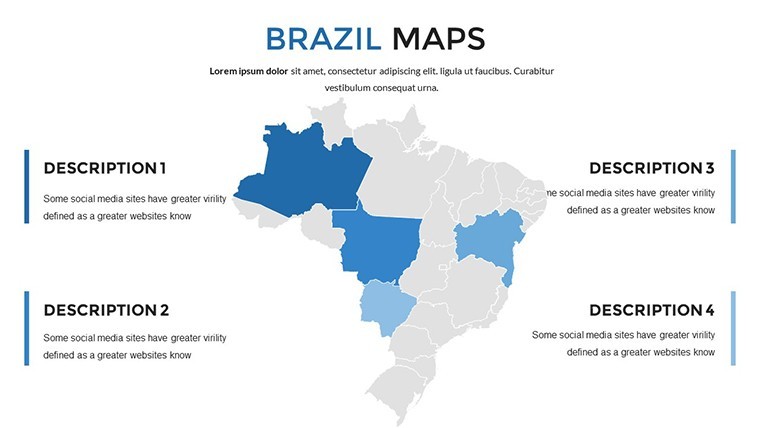
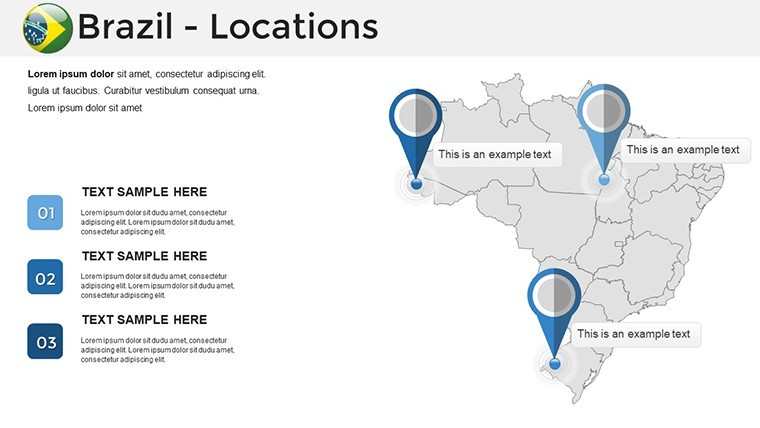
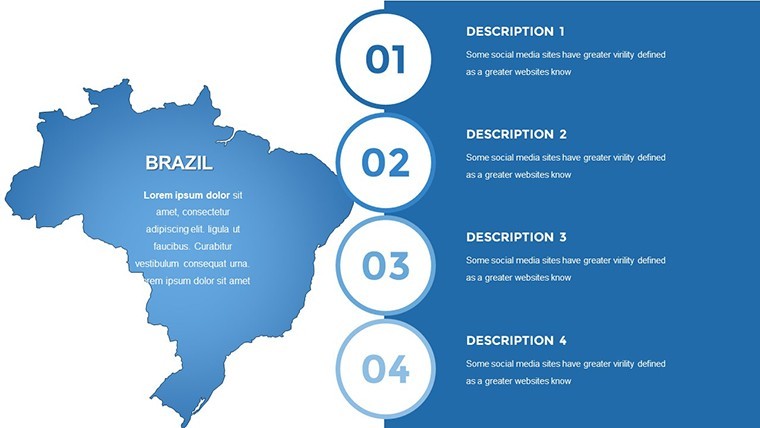
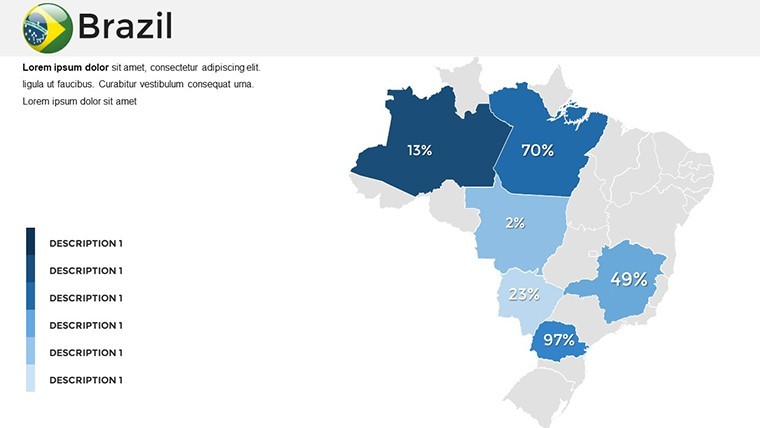
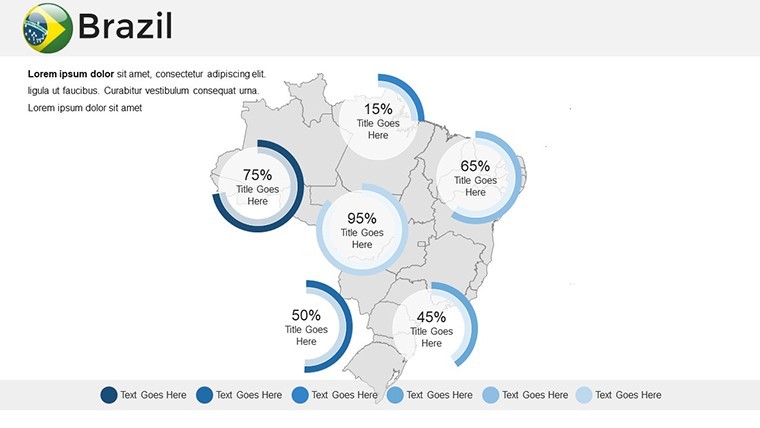
- State-Level Detail: Editable boundaries and labels for precise localization.
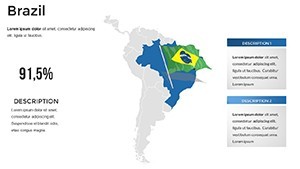
- Resource Overlays: Map forests, rivers, and farmlands with ease.
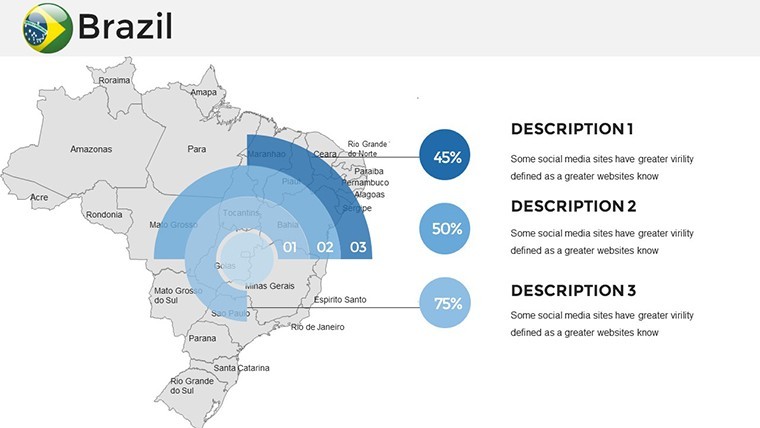
- Icon Library: Vector assets for quick enhancements.
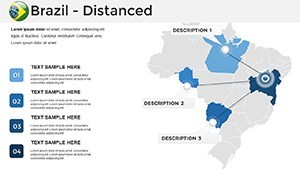
- Animation Support: Add motion to emphasize changes over time.
These features empower users to create polished outputs without advanced design skills.
Practical Scenarios for Brazil-Focused Content
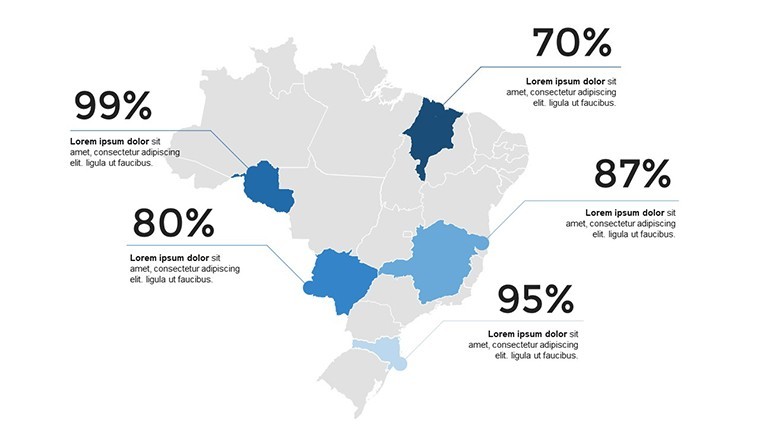
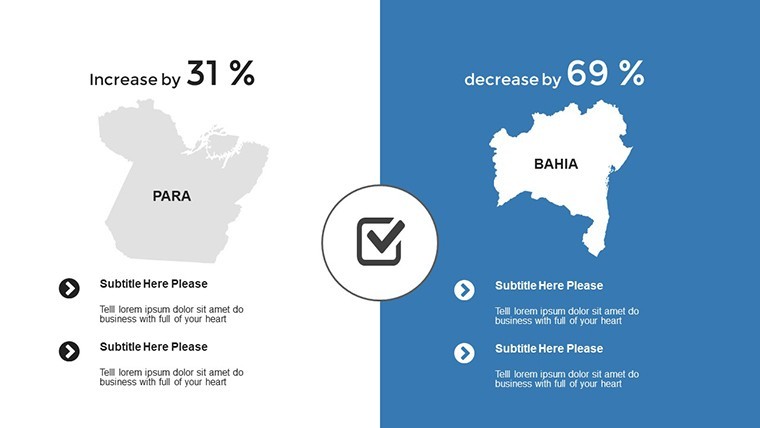
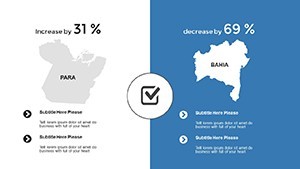
Consider a corporate pitch on biofuel investments: Use the template to map ethanol production zones in the Southeast, integrating data visuals that showcase growth potential, akin to strategies in Petrobras annual reports. For academia, animate the Amazon's role in global climate, helping students grasp concepts from IPCC studies.
In tourism, highlight cultural hotspots like Rio's Carnival with thematic maps, or for NGOs, overlay conservation areas to advocate for policies. The template excels in urban planning discussions, mapping population shifts to São Paulo with density heatmaps.
- Choose a base map and populate with your key data.
- Tweak visuals for thematic consistency, like earthy tones for natural resources.
- Incorporate charts from the built-in options for depth.
- Test animations and export for cross-platform use.
This methodical approach boosts efficiency, letting you focus on insights.
Pro Tips for Engaging Maps
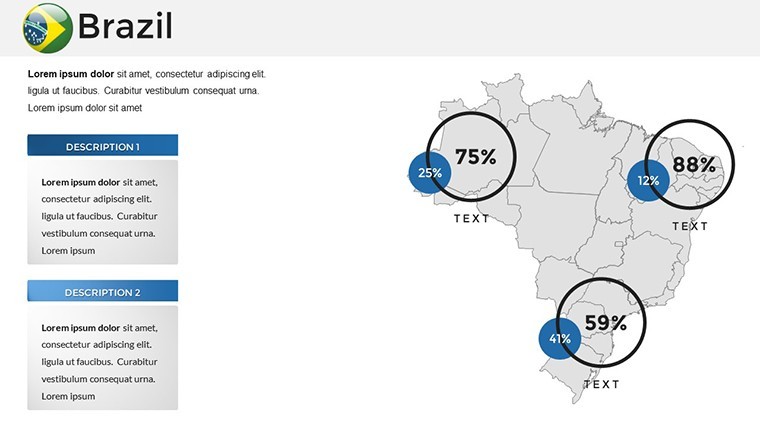
Apply cartography basics: Use scale bars for context and legends for clarity. Inspired by AIA spatial design, arrange elements for balanced views. Unlike basic tools, our template's custom animations provide a narrative edge, often leading to higher engagement in webinars.
Value adds include PNG exports for web use and internal linking to South American templates for broader context.
Standout Qualities in Resource Mapping
Its edge? Comprehensive coverage of Brazil's assets, from forests to economy, with editable flexibility that outshines generics. Trusted for accuracy, it's like having a geographer's toolkit at hand.
Unlock Brazil's potential in your next presentation - grab this template now.
Frequently Asked Questions
- How many slides does it include?
- 36 fully editable slides focused on Brazil's maps and data.
- Can I edit colors and add animations?
- Yes, complete customization including colors, texts, and custom effects.
- Compatible with what platforms?
- Keynote primary, but works with PowerPoint and Google Slides.
- What extras are in the download?
- Vector icons, PNG files, and .key sources.
- Suited for which uses?
- Business, education, environmental, and economic presentations.