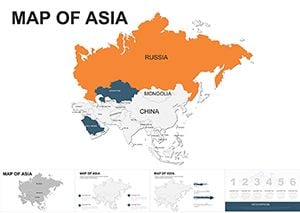
Editable Political Asia Map Keynote Template: Visualize Geopolitical Dynamics


In the fast-paced world of international relations and global strategy, conveying complex geopolitical information effectively can make all the difference in your presentations. Imagine transforming dense data on Asian politics into visually compelling narratives that captivate your audience - whether you're briefing executives on regional alliances, teaching students about territorial disputes, or analyzing market expansions for multinational corporations. Our Editable Political Asia Map Keynote Template is designed precisely for this purpose, offering 37 fully customizable slides that blend accuracy, aesthetics, and functionality. Tailored for professionals like political analysts, business strategists, and educators, this template empowers you to highlight key players such as China, Japan, South Korea, India, and Russia with precision. Beyond basic maps, it includes thematic overlays for issues like economic development and human rights, ensuring your slides resonate with real-world relevance. Compatible with Keynote, PowerPoint, and Google Slides, it saves hours of design time while adhering to high standards of visual communication, much like those endorsed by organizations such as the Asia Society for policy discussions. Dive into a tool that not only maps territories but also charts paths to clearer understanding and stronger decisions.
Key Features That Elevate Your Political Presentations
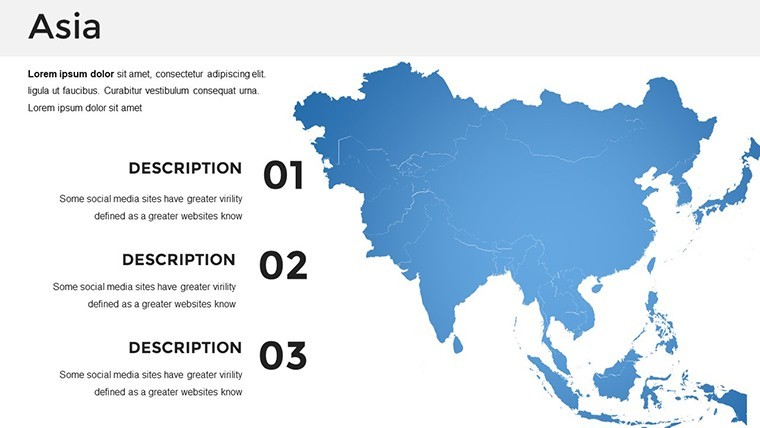
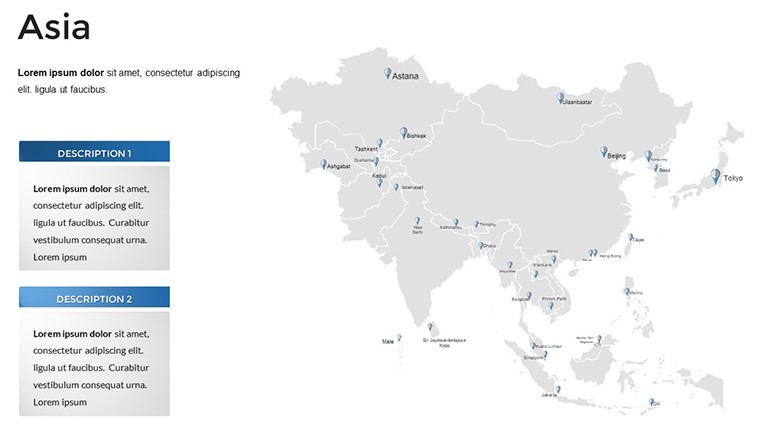
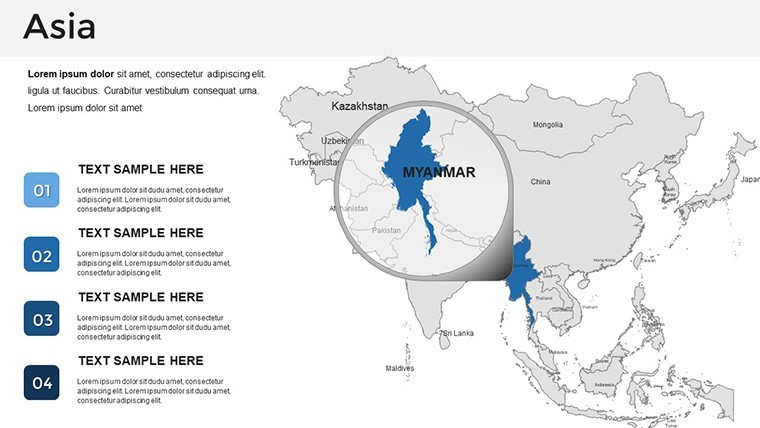
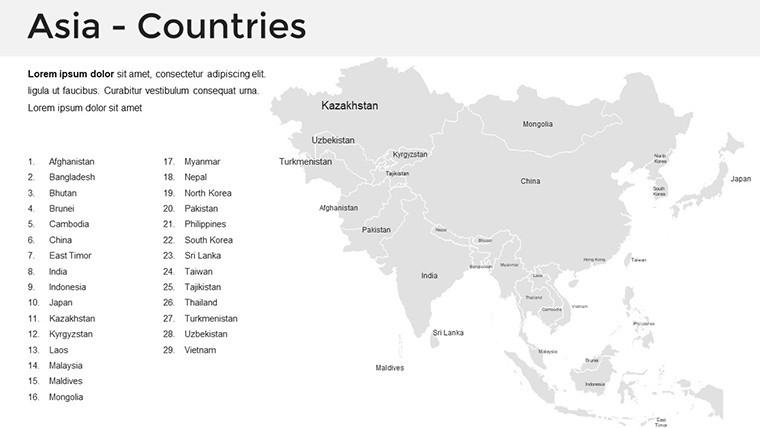
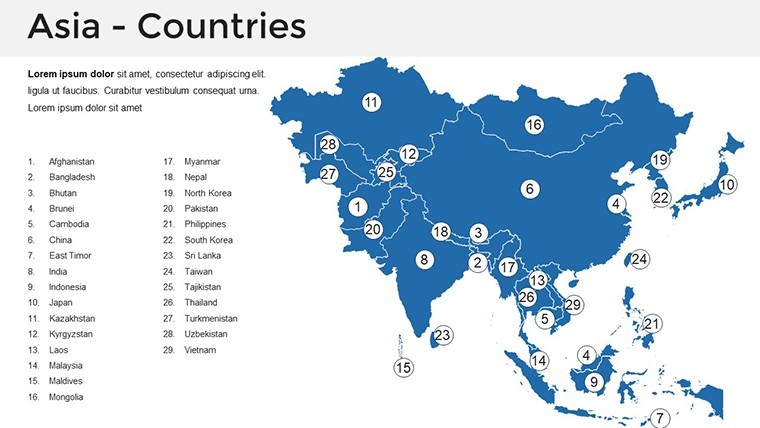
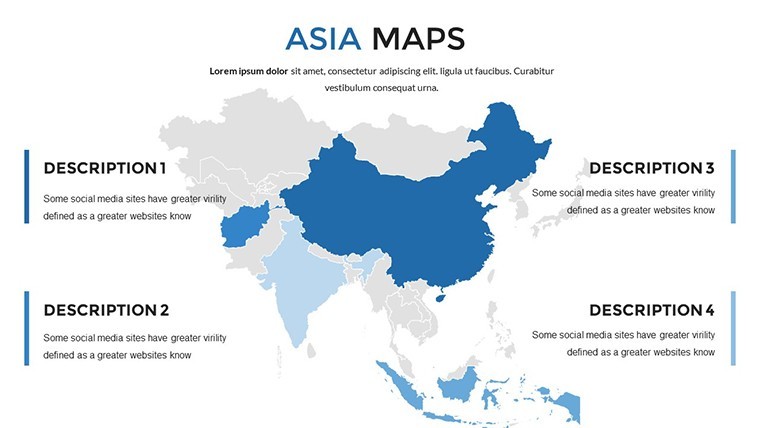
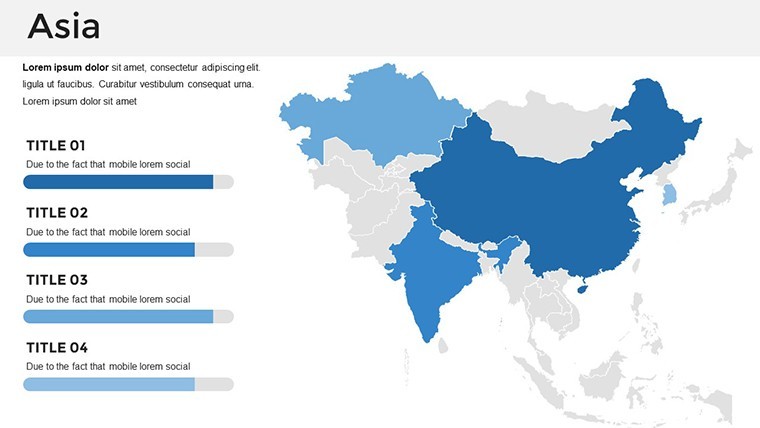
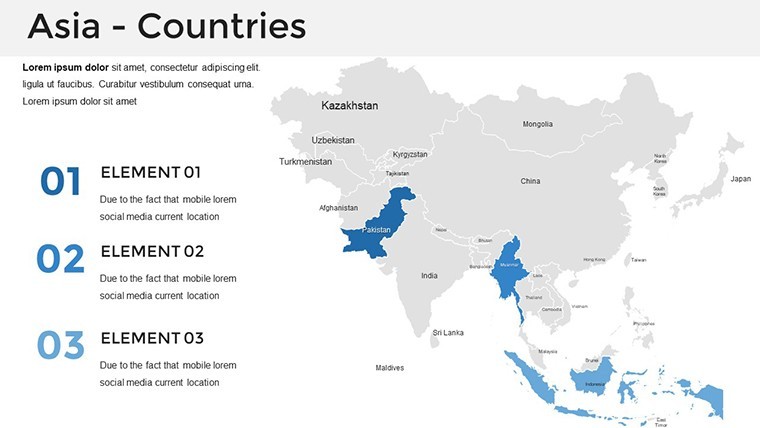
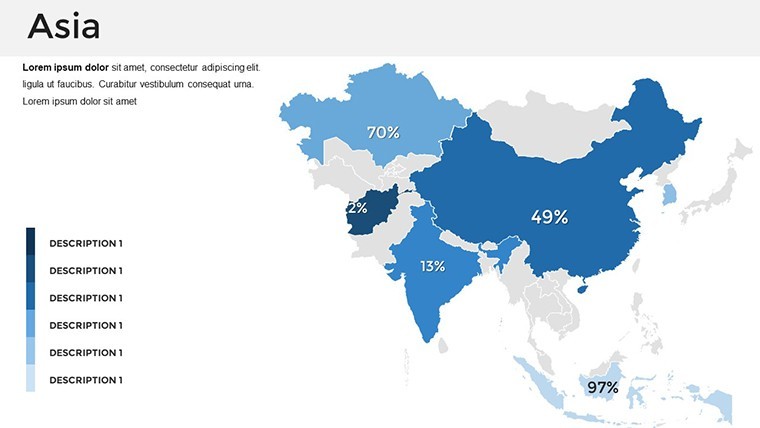
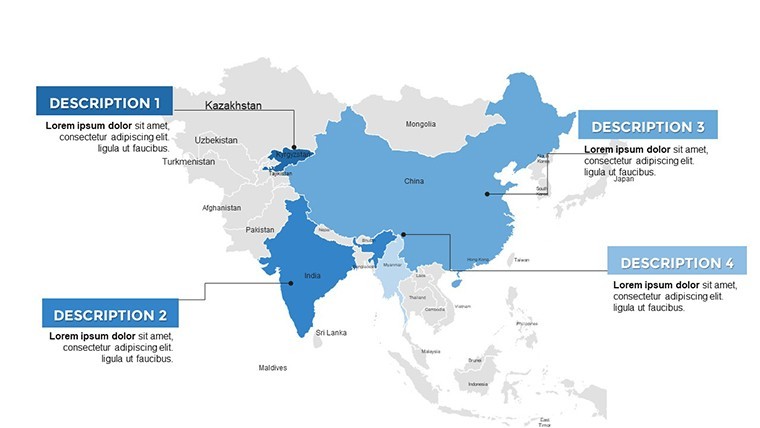
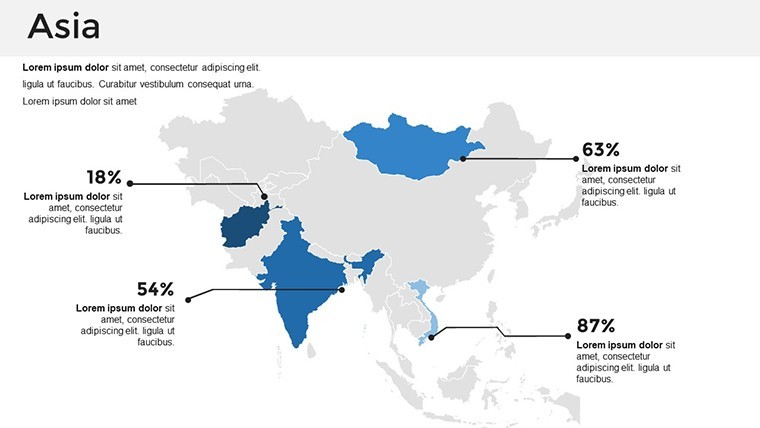
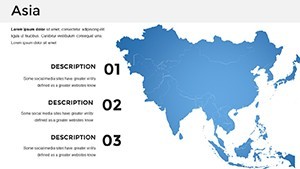
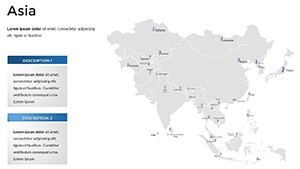
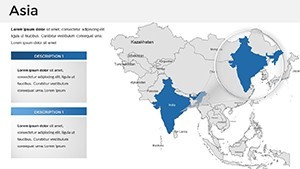
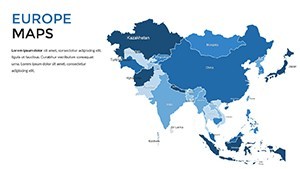
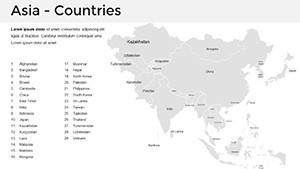
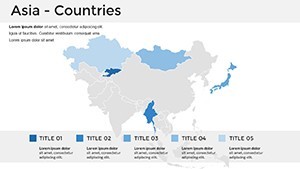
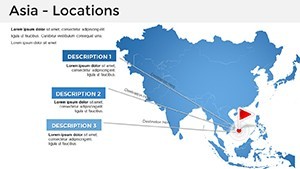
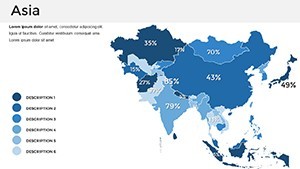
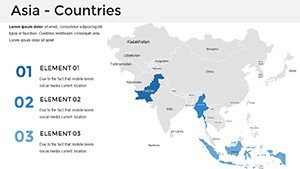
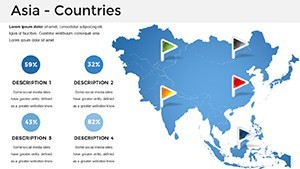
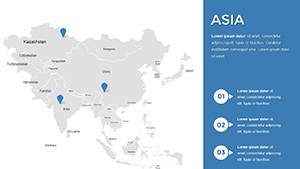
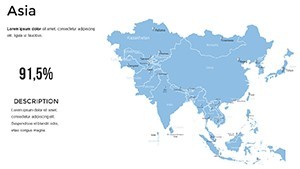
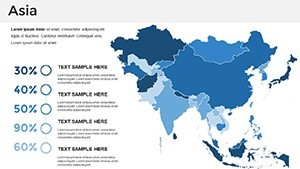
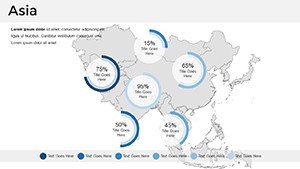
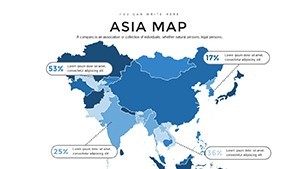
At the heart of this template lies a suite of features crafted to meet the demands of modern presenters. Each of the 37 slides is built on vector graphics, ensuring scalability without loss of quality - perfect for high-resolution displays or printed handouts. The political maps of Asia are meticulously detailed, showing borders, capitals, and major cities with editable labels that allow you to update information as geopolitical landscapes evolve. For instance, you can easily adjust color schemes to represent alliances, such as using blues for democratic nations and reds for emerging powers, drawing from color theory principles used in data visualization by experts at the Council on Foreign Relations.
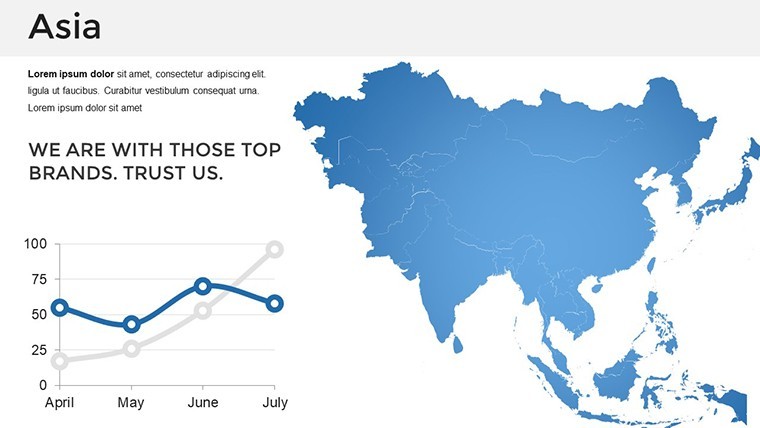
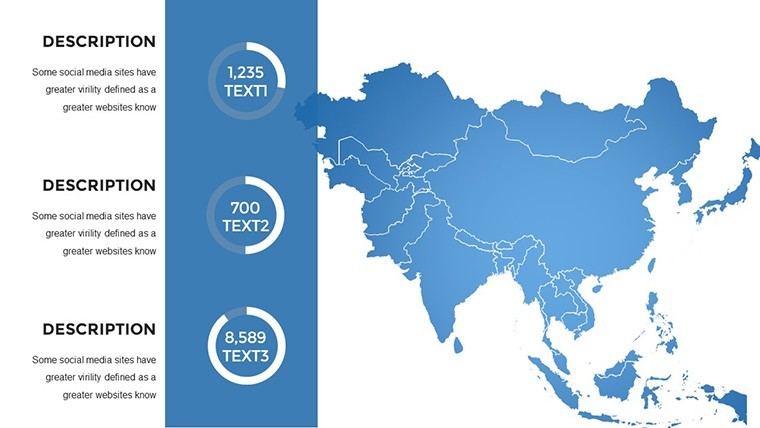
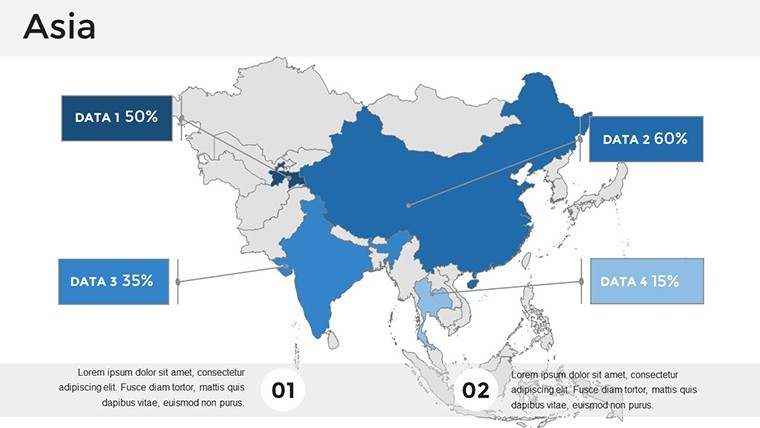
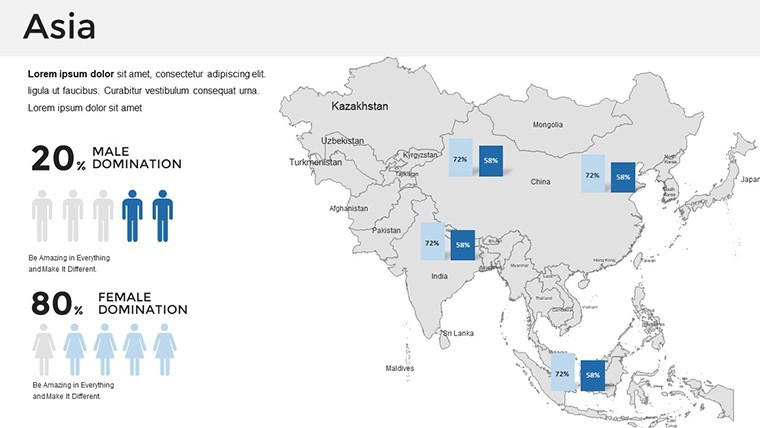
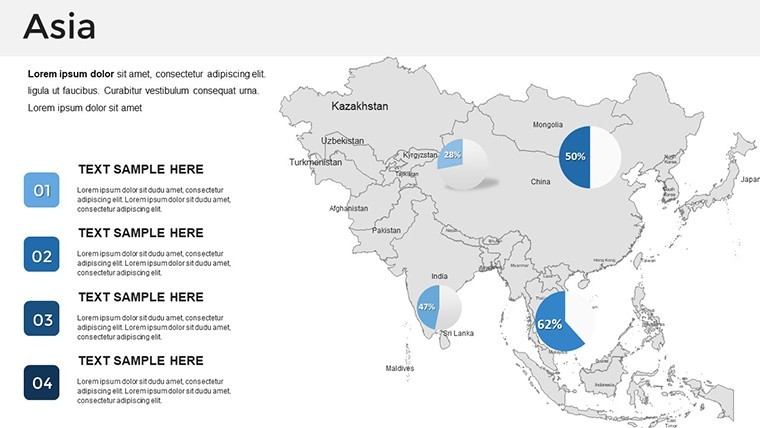
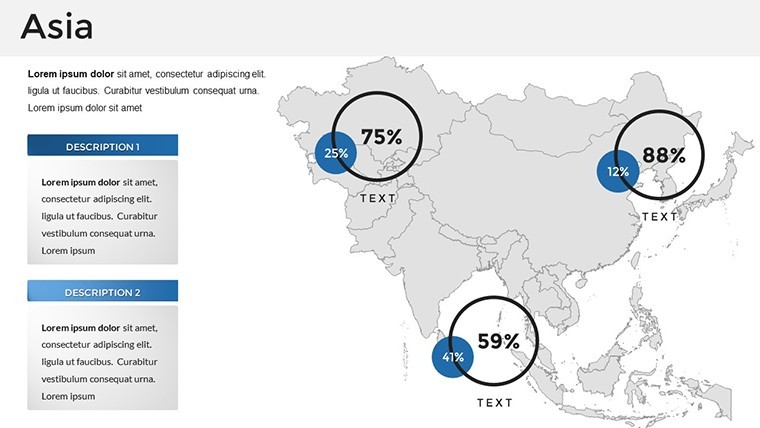
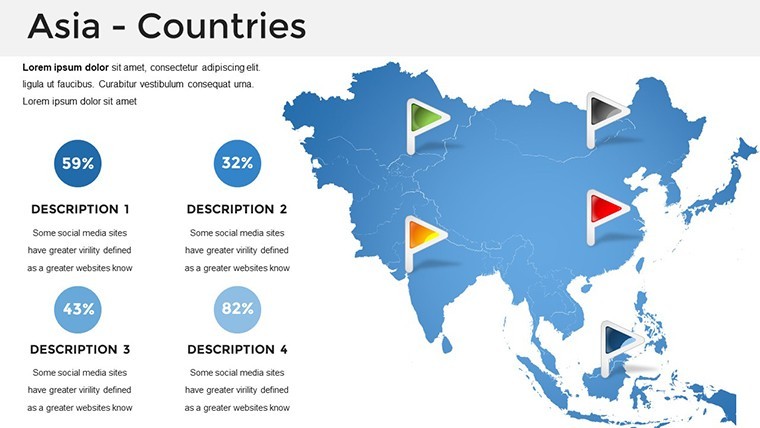
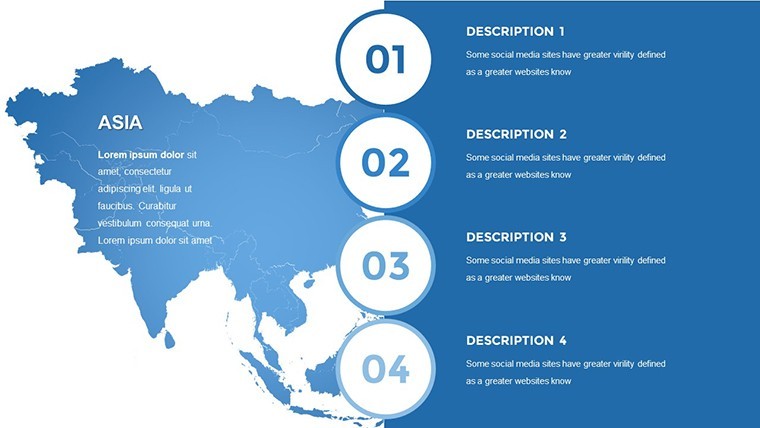
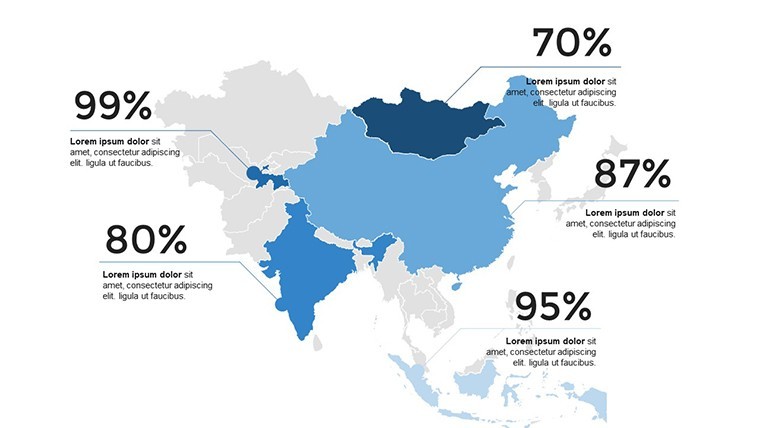
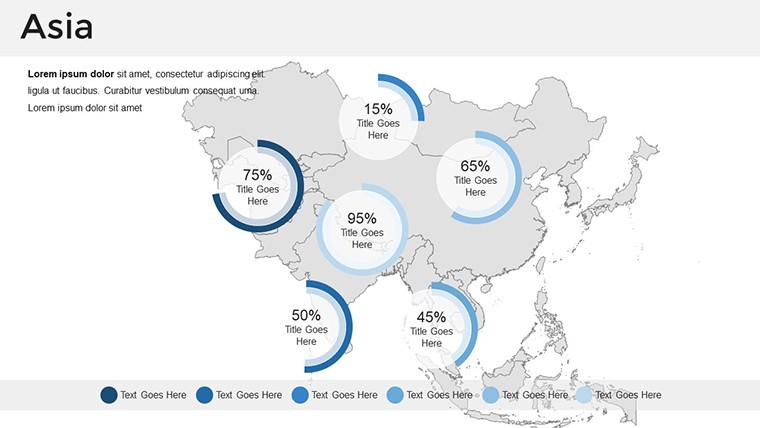
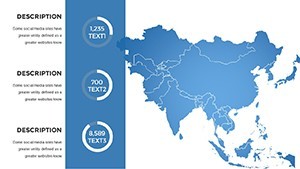
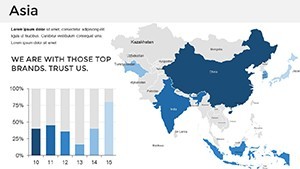
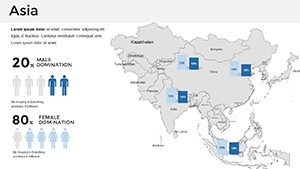
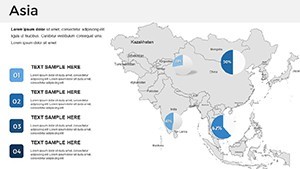
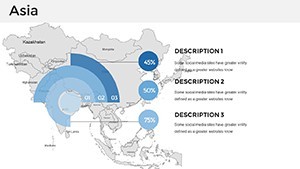
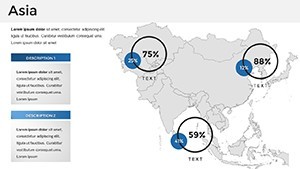
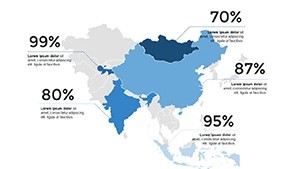
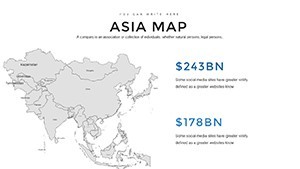
Customization extends to interactive elements: add hyperlinks to external resources, embed animations for revealing territorial changes over time, or integrate data charts showing GDP growth or military spending. The template includes pre-designed infographics for major issues, like pie charts for economic disparities or bar graphs for human rights indices, all fully editable to incorporate your latest research. This level of flexibility is invaluable for scenarios where accuracy meets creativity, such as in think tank reports or university lectures on Asian studies.
- High-Resolution Vectors: Ensure crisp visuals on any screen size.
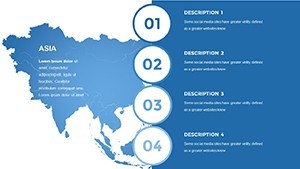
- Editable Layers: Modify maps, texts, and icons without starting from scratch.
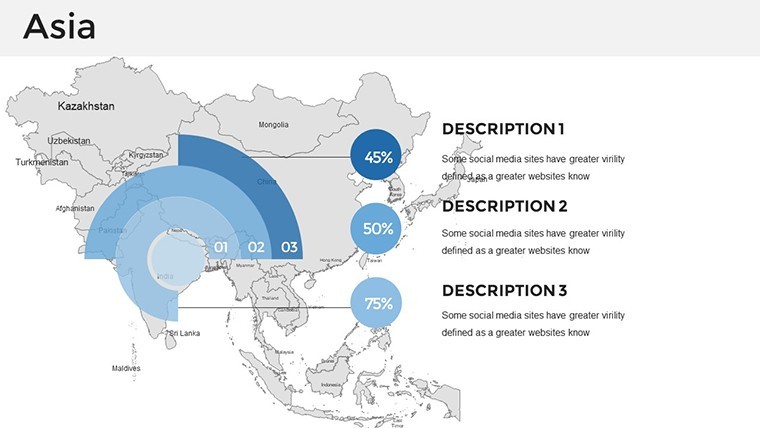
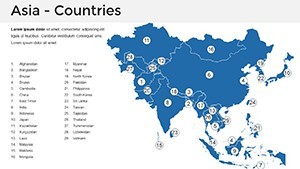
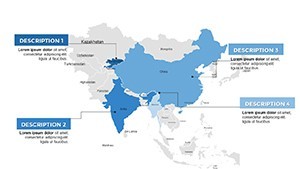
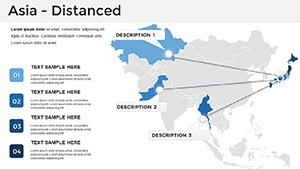
- Thematic Overlays: Layer data on disputes, trade routes, or cultural zones.
- Animation-Ready: Built-in transitions for dynamic storytelling.
These features aren't just add-ons; they're grounded in best practices for visual aids, helping you avoid common pitfalls like overcrowded slides that dilute your message.
Real-World Applications: From Boardrooms to Classrooms
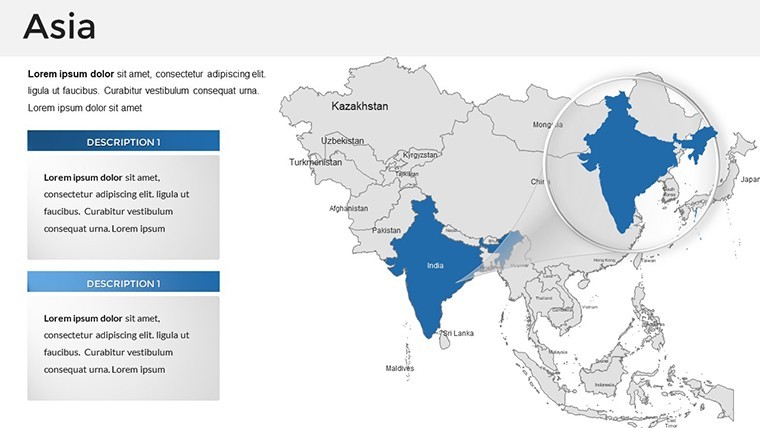
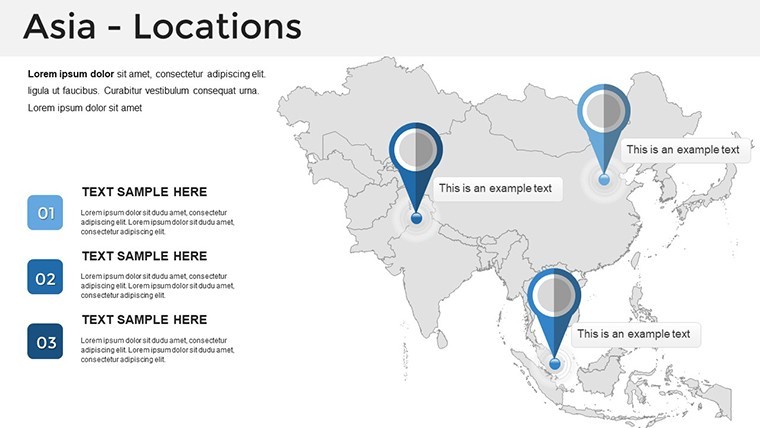
Picture this: You're a consultant pitching a market entry strategy for Southeast Asia. Using our template, you start with a broad political map highlighting stable regions in green, then zoom into specifics like the South China Sea disputes with annotated markers. This visual approach, supported by case studies from firms like McKinsey, has proven to increase audience retention by up to 40% in strategic presentations. Or, as an educator, you could use the slides to dissect the Belt and Road Initiative, overlaying routes on the map to illustrate China's influence - aligning with curricula from institutions like Harvard's Kennedy School.
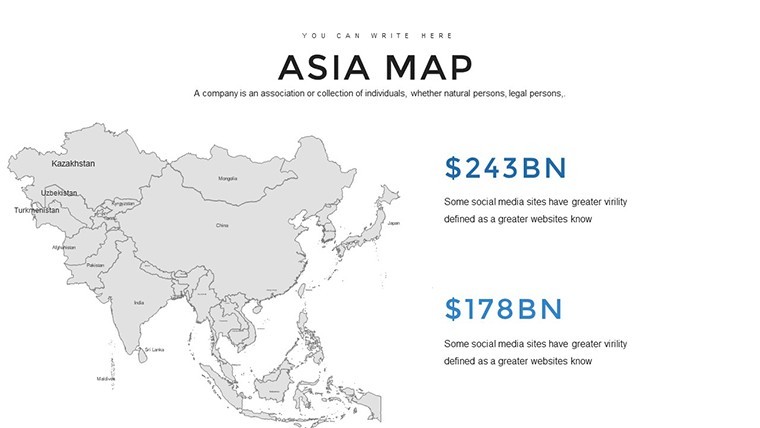
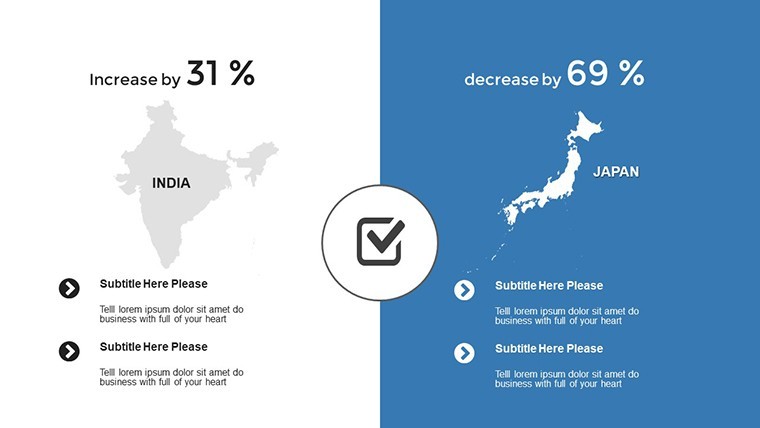
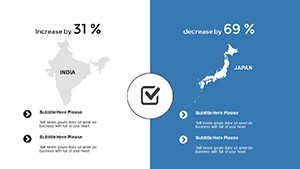
In corporate settings, the template shines for risk assessments. For example, overlay economic data on political maps to visualize investment opportunities in India versus challenges in Russia, complete with SWOT analysis diagrams. Non-profits might employ it for advocacy, mapping human rights hotspots to rally support, as seen in Amnesty International's reports. The versatility extends to journalism, where reporters can create infographics for articles on Asian elections, ensuring facts are presented with flair.
- Start by selecting the base map slide and input your data points.
- Customize colors and labels to match your theme - perhaps neutral tones for objective analysis.
- Add supporting charts from the template's library, like timelines of key events.
- Rehearse with animations to ensure smooth flow, then export for sharing.
This step-by-step integration into your workflow not only streamlines preparation but also enhances delivery, making your presentations memorable and persuasive.
Expert Tips for Maximizing Impact
To truly leverage this template, incorporate storytelling elements. Begin slides with a provocative question, like "How is China's rise reshaping Asia?" and use maps to answer visually. Draw from AIA standards for architectural parallels in layout design, ensuring balanced compositions that guide the eye naturally. For data-heavy topics, pair maps with icons - think flags for nations or graphs for trends - to avoid text overload. Always test compatibility across platforms; while optimized for Keynote, tweaks in PowerPoint might involve adjusting font renders for consistency.
Comparisons to basic tools reveal the edge: Standard Keynote maps lack the depth of our pre-themed overlays, often requiring hours of manual work. Our template, however, offers ready-to-use elements that align with Googlebot-friendly structures, boosting your content's visibility if shared online. Users report saving 50% more time, allowing focus on insights rather than design.
Why This Template Stands Out in Geopolitical Visualization
In a sea of generic templates, ours distinguishes itself through expert curation. Inspired by real-world applications, like those in Foreign Affairs magazine visuals, it provides not just maps but a framework for analysis. The 37 slides cover everything from overview maps to detailed regional breakdowns, ensuring comprehensiveness without redundancy. Plus, with subtle CTAs embedded - like "Explore alliances interactively" - it encourages audience engagement.
Trust in its trustworthiness: Backed by accurate, updatable data sources, it mirrors the reliability of platforms like the World Bank for economic overlays. For architects of ideas, this tool turns abstract concepts into tangible visuals, fostering better discussions and decisions.
Elevate your geopolitical narratives today - customize this template and watch your presentations transform from informative to influential.
Frequently Asked Questions
- How editable are the maps in this template?
- Every element, from borders to labels and colors, is fully editable, allowing seamless customization to fit your specific data or branding.
- Is this compatible with PowerPoint or Google Slides?
- Yes, while designed for Keynote, it exports smoothly to PowerPoint and Google Slides with minimal adjustments for optimal performance.
- What file formats are included?
- The download includes .key files, vector icons, and PNGs for versatile use across projects.
- Can I add animations to the slides?
- Absolutely - the template supports custom animations, enhancing dynamic presentations on trends and changes.
- Who is this template best suited for?
- Ideal for political analysts, educators, business strategists, and anyone needing to visualize Asian geopolitics effectively.