Australia Keynote Maps Template - Editable & Professional


Type: Keynote Maps template
Category: Australia
Sources Available: .key
Product ID: KM00020
Template incl.: 36 editable slides
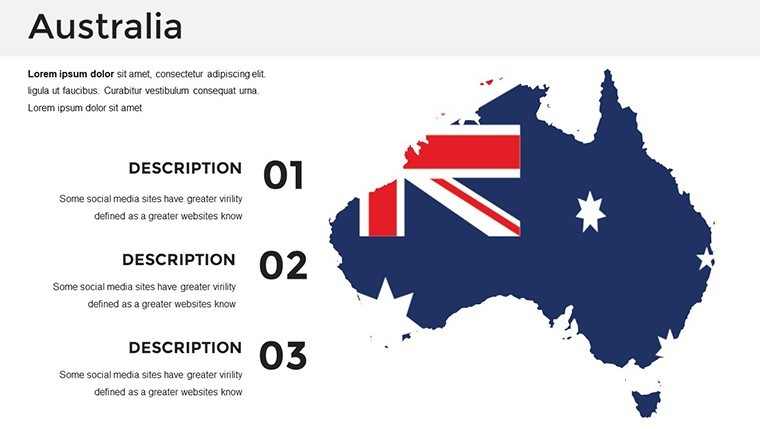
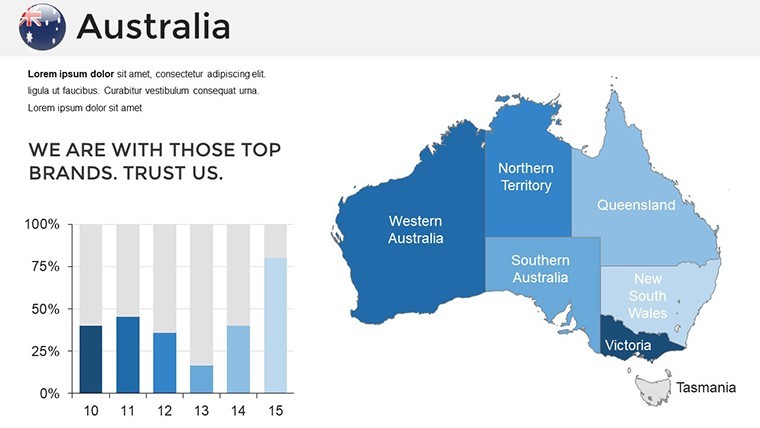
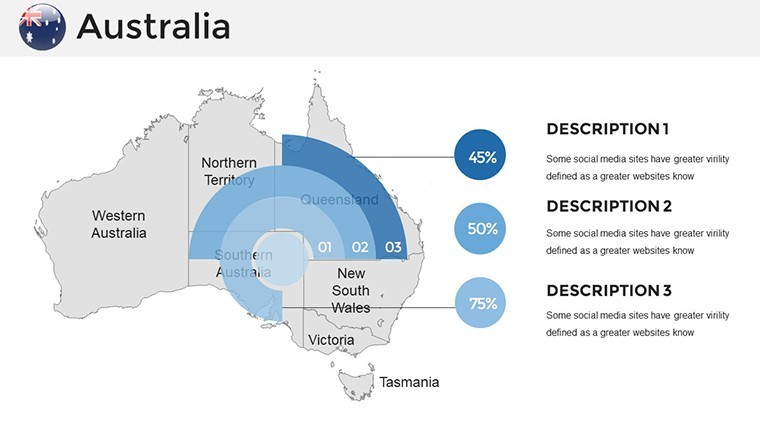
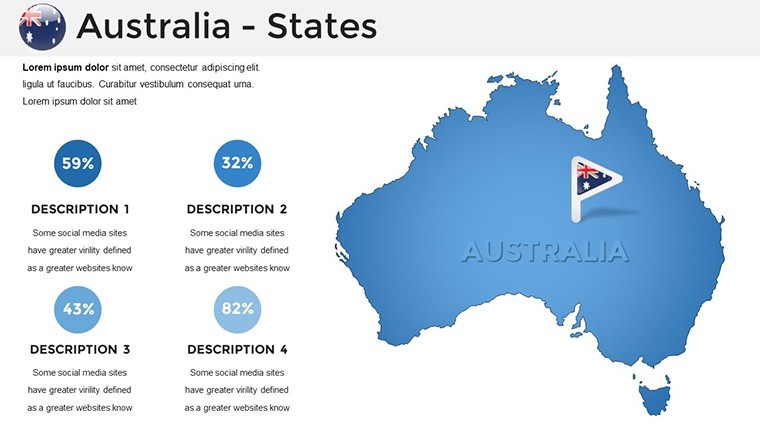
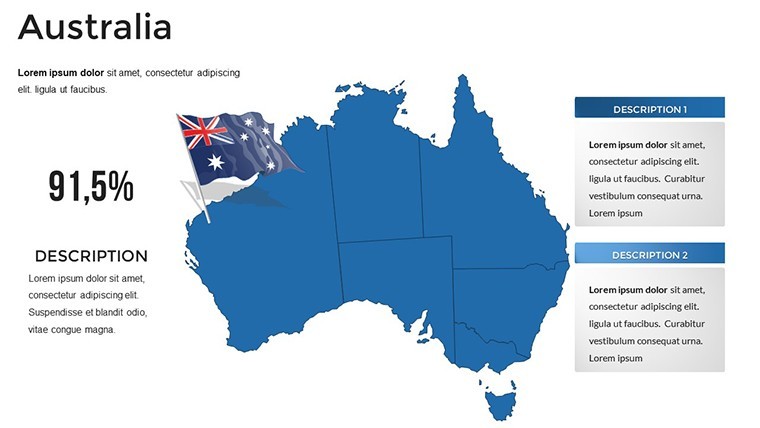
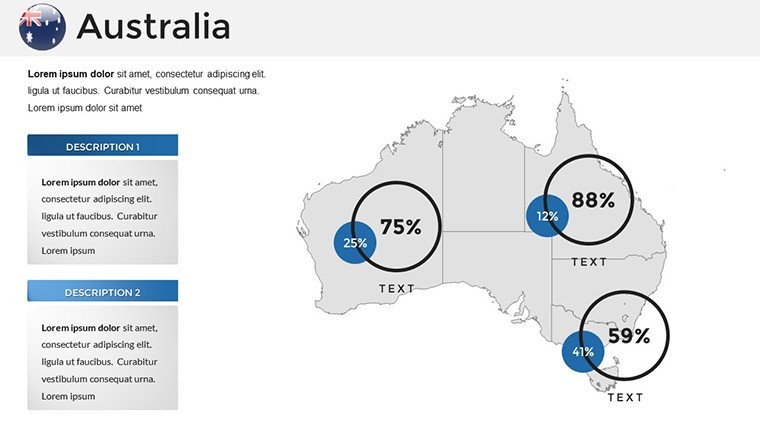
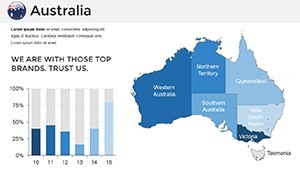
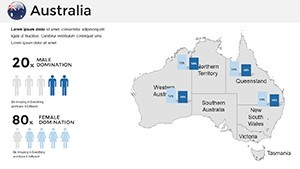
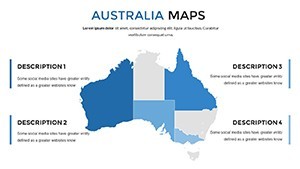
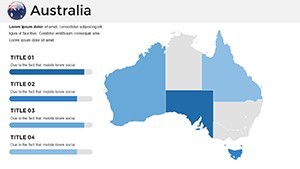
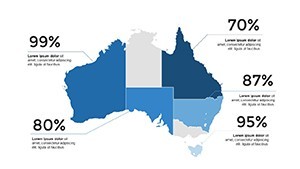
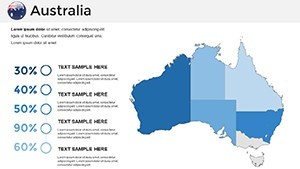
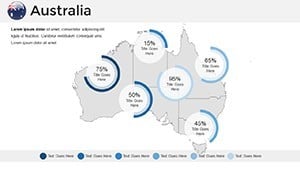
Envision mapping Australia's expansive outback and coastal wonders in a way that captivates and informs. Our Australia Keynote Maps Template delivers just that, with 36 editable slides crafted for professionals tackling environmental challenges, business expansions, or academic explorations. Suited for ecologists charting biodiversity, executives planning regional strategies, or teachers explaining geological features, this tool transforms raw data into compelling visuals.
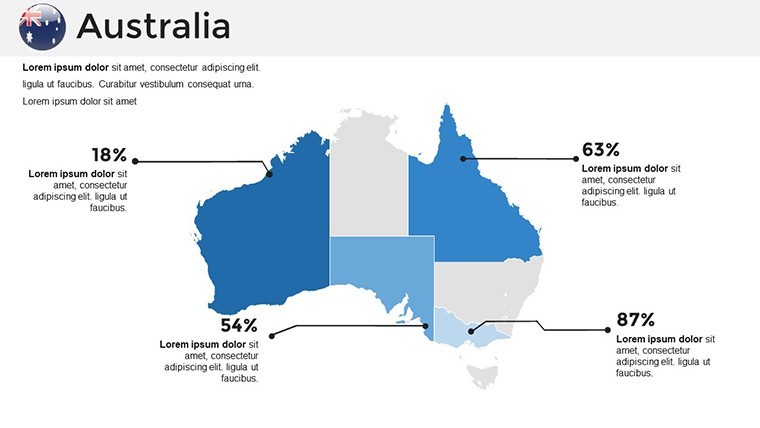
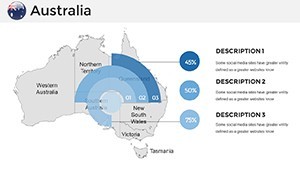
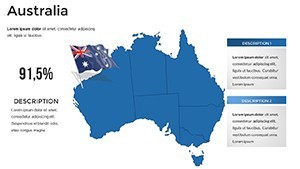
Focused on ease and precision, the template highlights Australia's unique geography - from the Great Barrier Reef to the arid Red Centre. Editability is key: tweak political boundaries, add environmental overlays, or incorporate business metrics all within Keynote's ecosystem. As Datalabs Agency's rewilding project demonstrates, interactive maps like these make complex initiatives accessible, inspiring action and understanding.
This retina-ready, full HD template ensures your presentations pop on any device. With custom animations and clean designs, it's a step up from standard slides, addressing the need for innovative visuals in fields like climate analysis, per the Geospatial Council of Australia's economic impact studies.
Standout Features for Dynamic Presentations
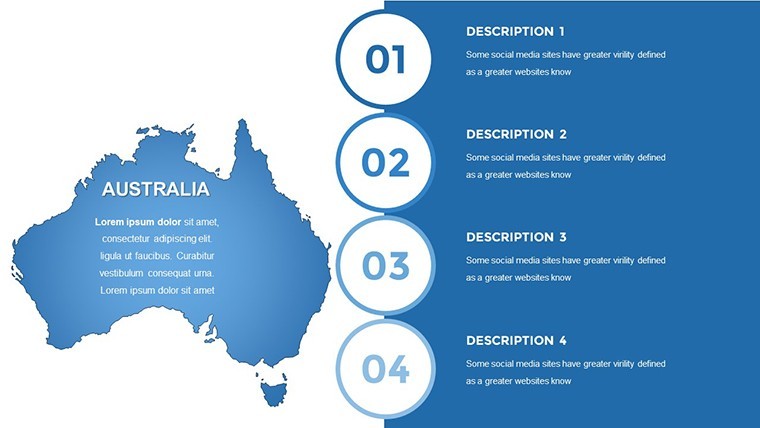
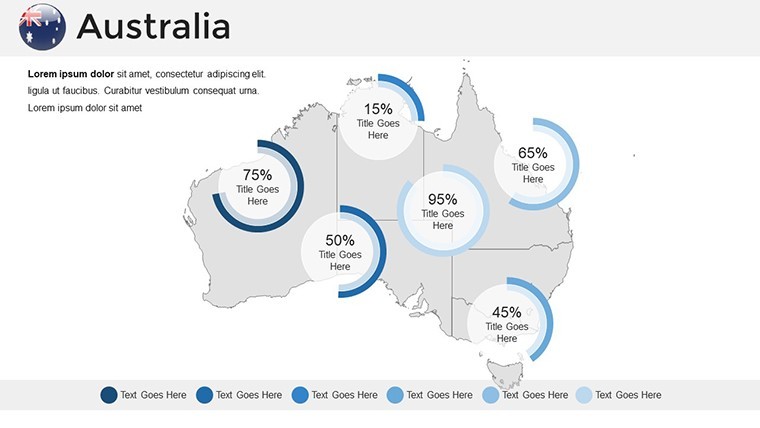
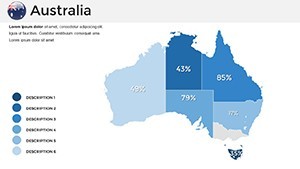
The strength lies in its robust feature set, designed for modern presenters. Handcrafted maps provide a foundation for customization, supporting everything from simple overviews to intricate data layers.
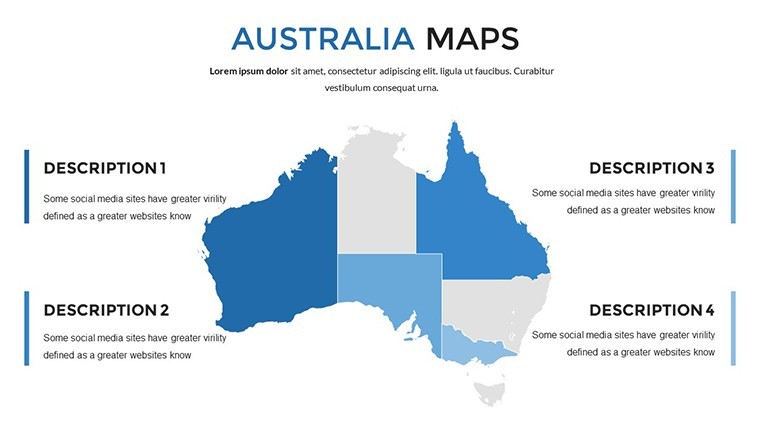
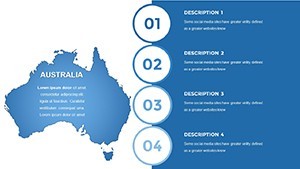
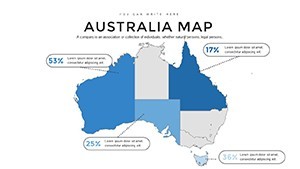
- Multipurpose and Creative Slides: Adapt for any topic, with clean layouts that blend simplicity and innovation.
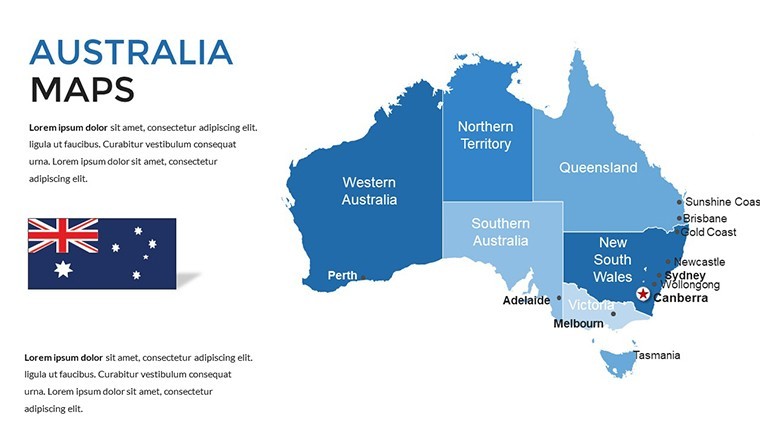
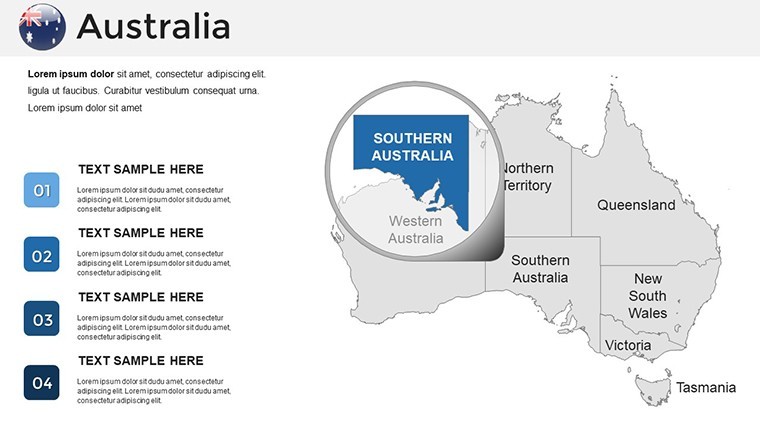
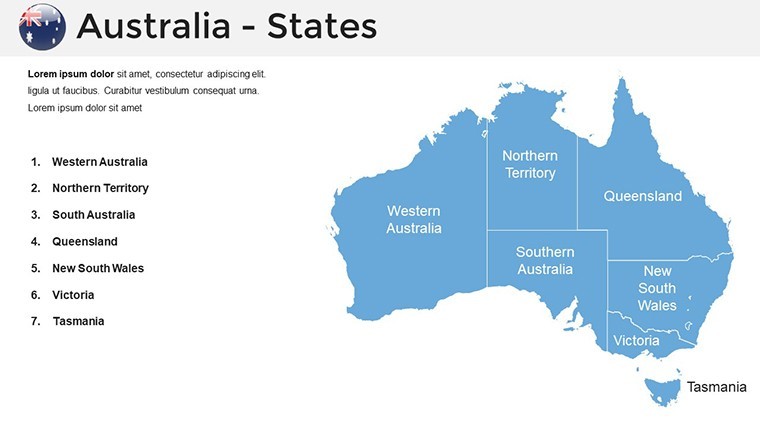
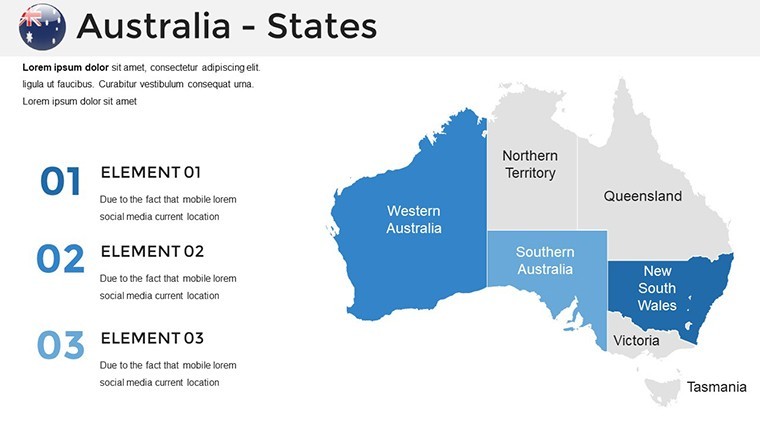
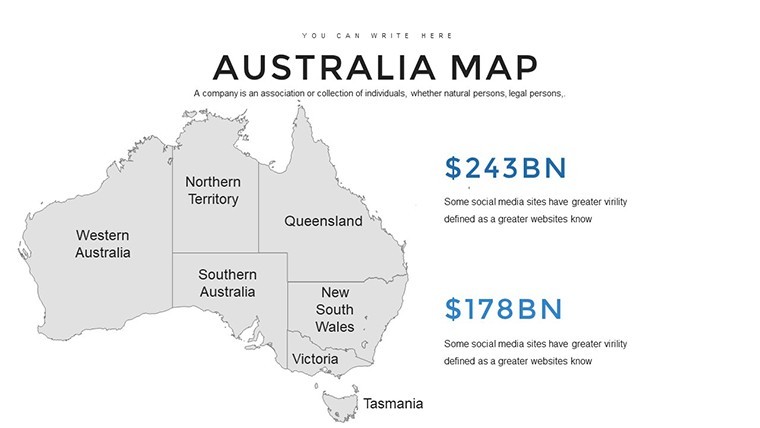
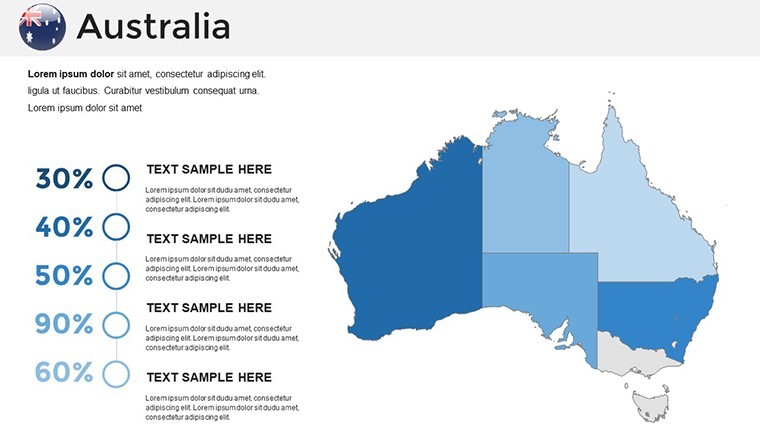
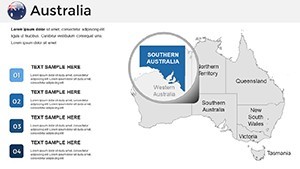
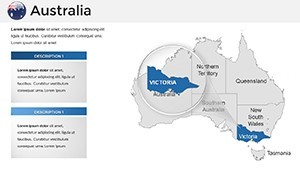
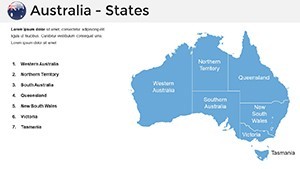
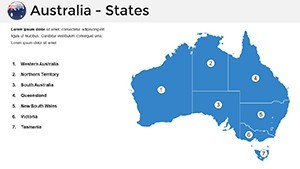
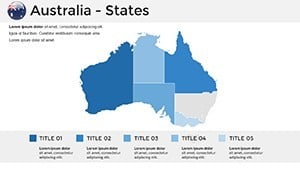
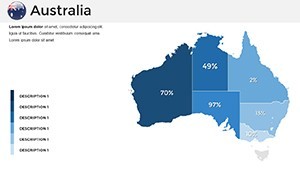
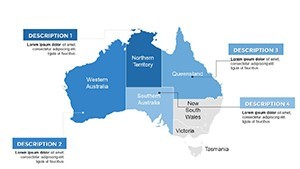
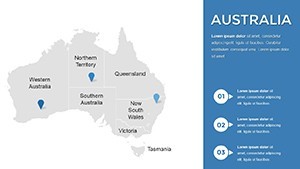
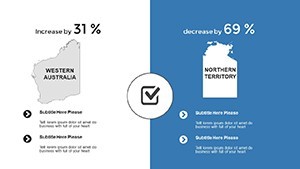
- Easy Editing Tools: Modify states like Queensland or Victoria with a few clicks, changing colors or adding grids.
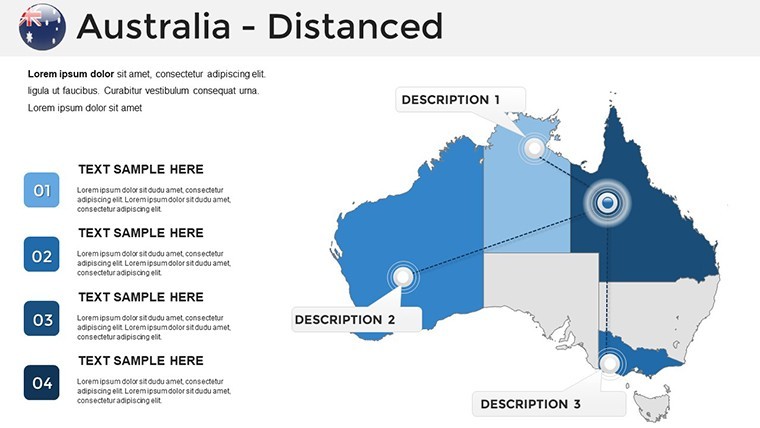
- Animation Capabilities: Animate environmental flows or business routes to engage viewers dynamically.
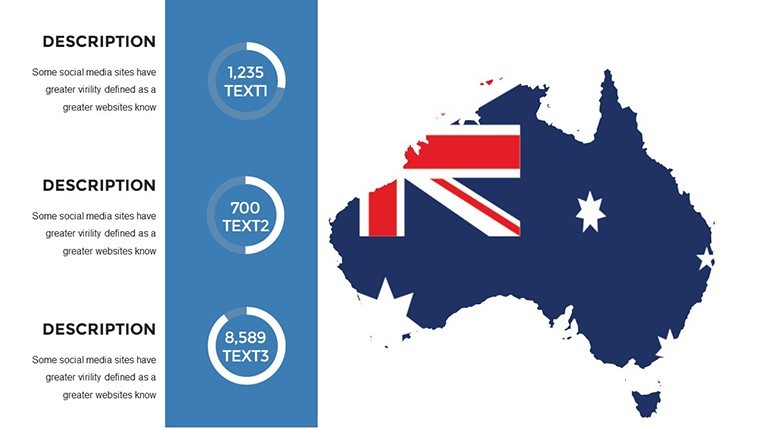
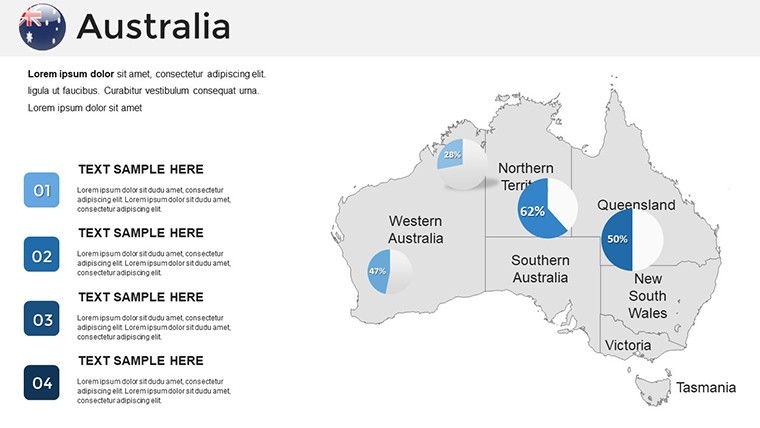
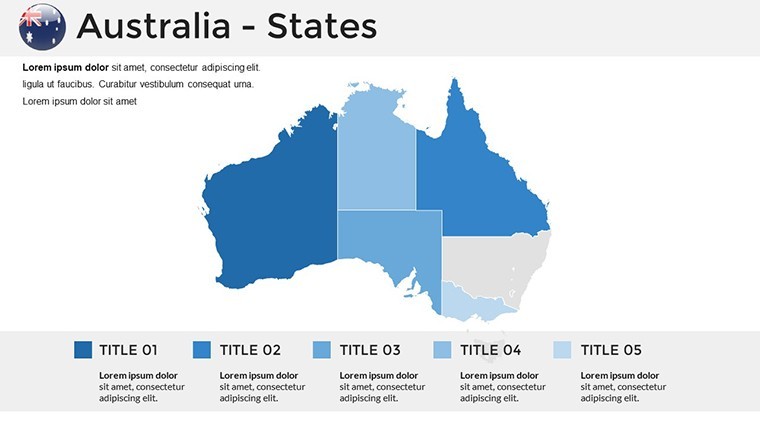
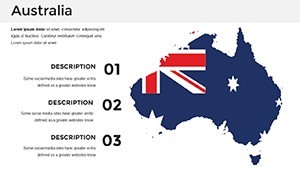
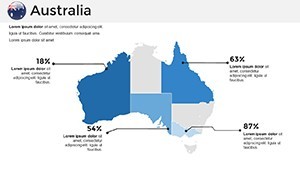
- Infographics and Breaks: Use handmade elements and section slides for structured, professional narratives.
- High-Quality Vectors: Stretch or resize without quality loss, ideal for detailed analyses.
These address pain points like visualizing vast territories, as in the ASAPa project's systems map for physical activity influences, where mapping aids holistic views.
Applications in Environmental and Business Contexts
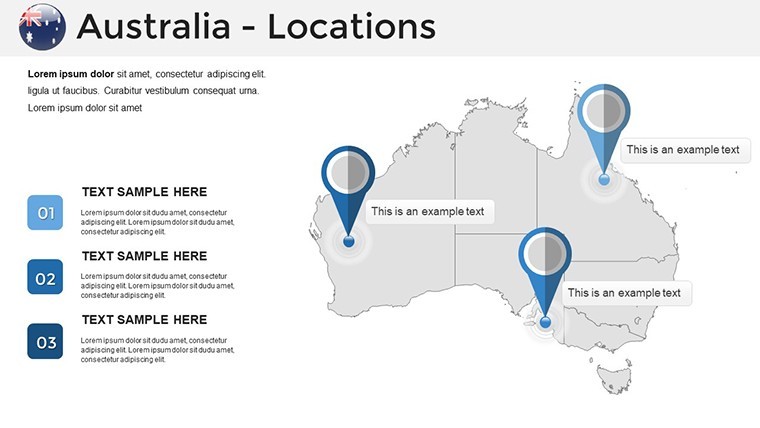
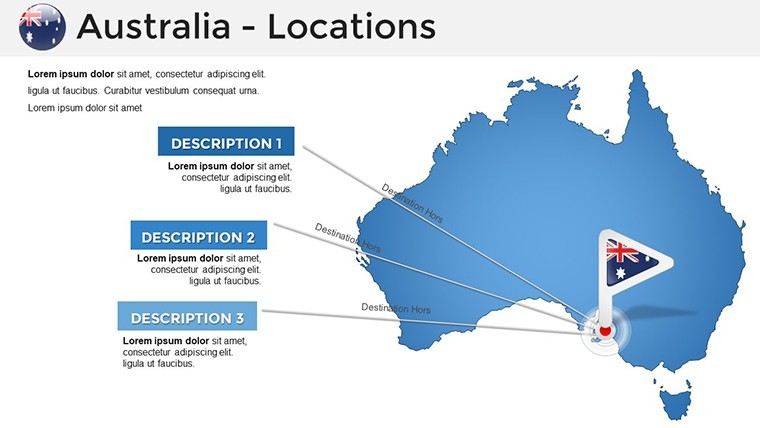
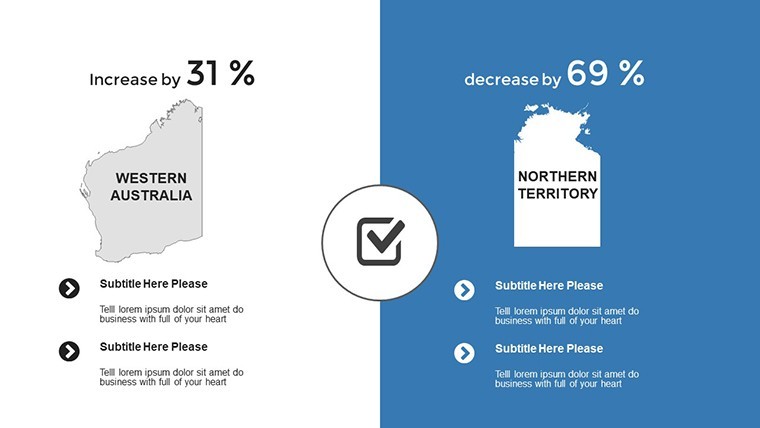
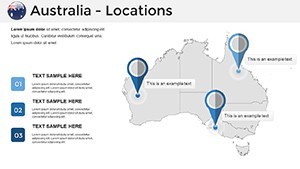
Apply this template to real scenarios for maximum effect. In environmental work, map rewilding efforts across Australia, overlaying data on endangered species - echoing Datalabs' interactive tool that publicizes conservation projects. Business users can illustrate supply chains from Sydney to Perth, incorporating economic indicators for stakeholder buy-in.
Case studies from Climate Change in Australia highlight using maps for risk assessments, like their ESCI tools for sector-specific frameworks. For education, depict geological formations or indigenous lands, drawing from TLCMap's researcher case studies that leverage digital mapping for humanities insights.
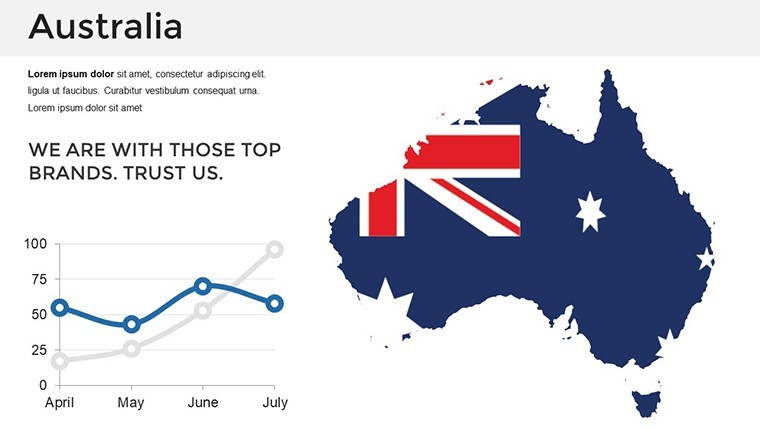
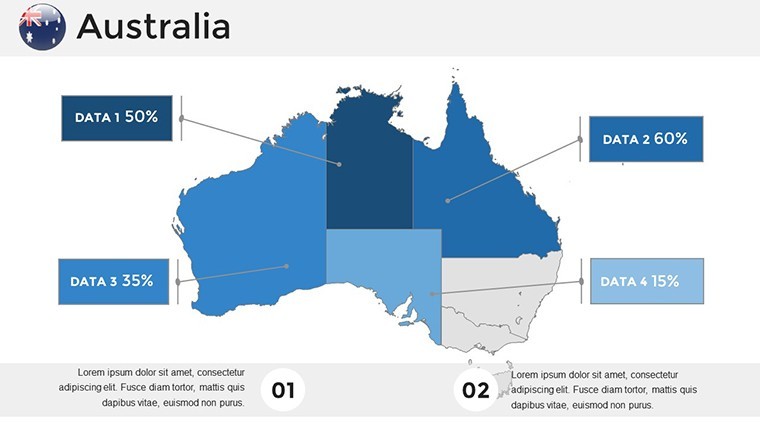
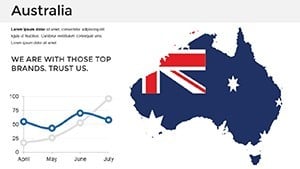
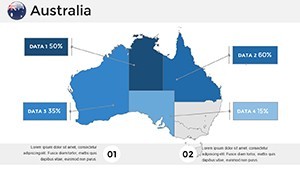
In a mining presentation, color-code resources in Western Australia, adding charts for production trends. Geoimage's satellite imagery case studies show how such visuals reveal patterns, enhancing decision-making in resource management.
Tailoring Maps: Step-by-Step Expertise
Launch in Keynote and pick a slide - perhaps a full-country political map. Edit colors: Double-click shapes to select from palettes, shading Tasmania green for forests. Add elements: Insert infographics for climate data or animations for ocean currents.
Expert advice: Balance detail with clarity - use legends for complex layers. Test animations for pacing, inspired by EFTF Showcase's geological mapping presentations. This method ensures your output is both informative and visually striking.
Achieving Excellence in Australian-Focused Presentations
Surpassing basic options, this template's professional style and documentation make it a go-to for impactful work. Align with ARDC's TLCMap uses, where case studies show mapping's research value. Workflow integration: Begin with overviews, delve into regions, conclude with actionable insights.
From environmental advocacy to business planning, its adaptability fosters success. Dive in and craft presentations that map Australia's potential vividly.
Frequently Asked Questions
How do I edit the Australia maps?
Simply double-click on shapes to change colors, sizes, or add text - fully editable in Keynote.
Suitable for environmental presentations?
Yes, with features for data overlays and animations to highlight ecological data effectively.
Compatible with which devices?
Works seamlessly on Mac, iPad, and supports full HD for professional displays.
Can I add custom animations?
Absolutely, each object supports custom animations for dynamic storytelling.
What extras are provided?
Includes quick guides, free fonts, and infographics for enhanced customization.