Botswana Keynote Map Template - Instant Download


Type: Keynote Maps template
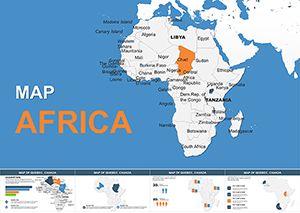
Category: Africa
Sources Available: .key
Product ID: KM00223
Template incl.: 37 editable slides
What is a Keynote map template? A Keynote map template is a ready-made .key file containing pre-built geographic slides - editable shapes, region labels, and infographic placeholders - that open directly in Apple Keynote for immediate customization.
Package Contents
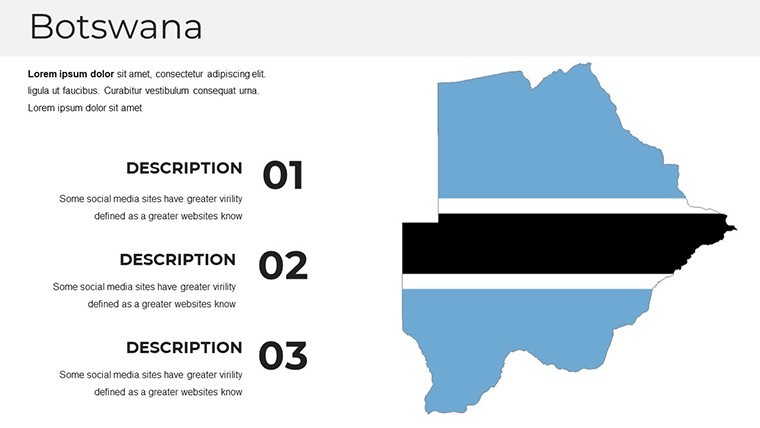
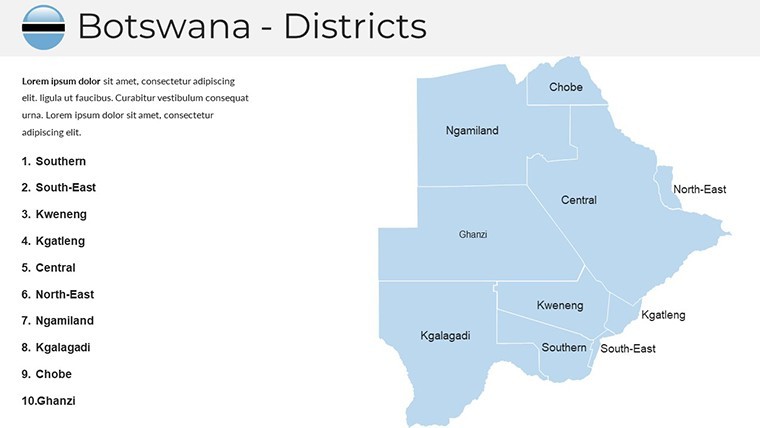
37 editable slides covering Botswana's national territory, regional divisions, and thematic map layouts. The download is a single .key file formatted for Apple Keynote, sized at the standard 16:9 widescreen ratio. Each slide uses vector-based region shapes, so boundaries and fills scale cleanly whether displayed on a laptop or a conference room projector.
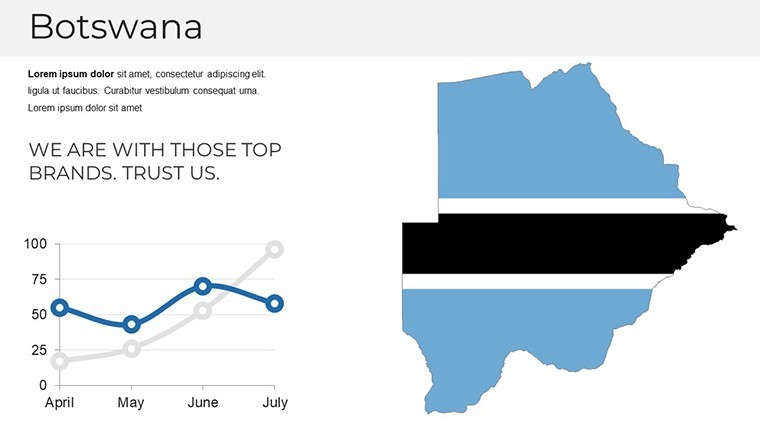
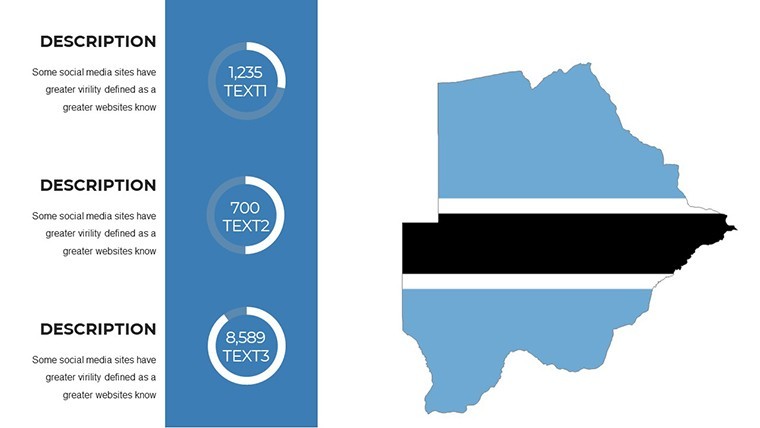
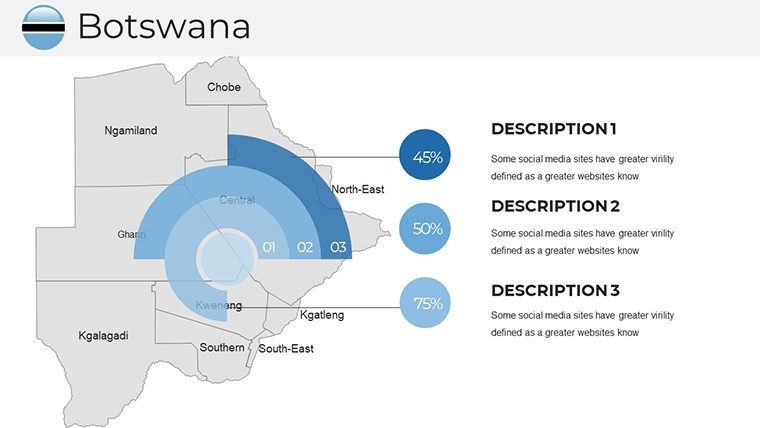
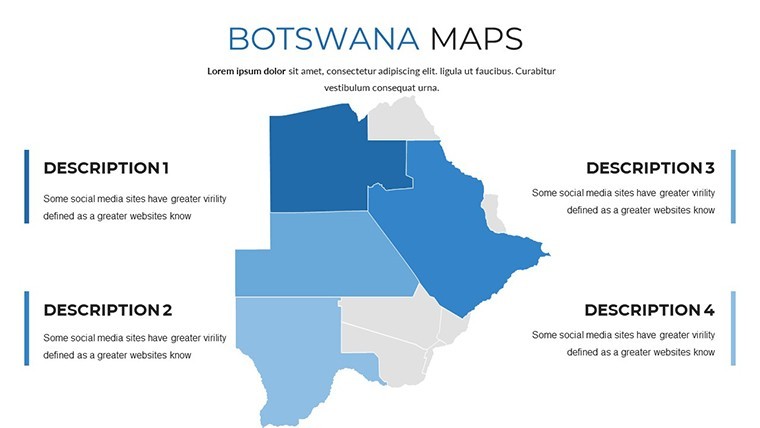
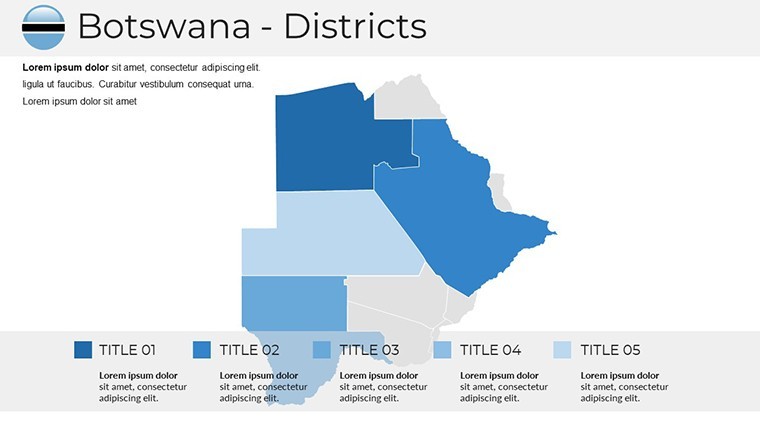
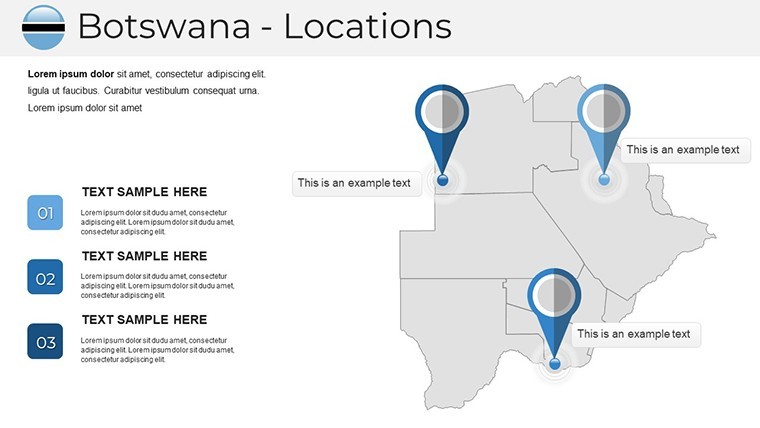
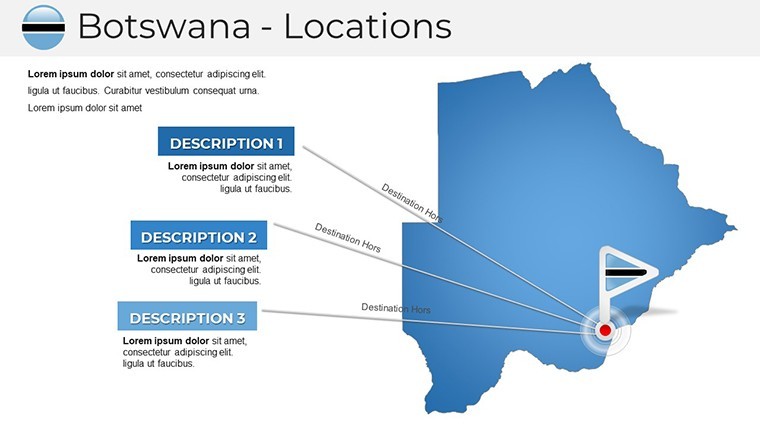
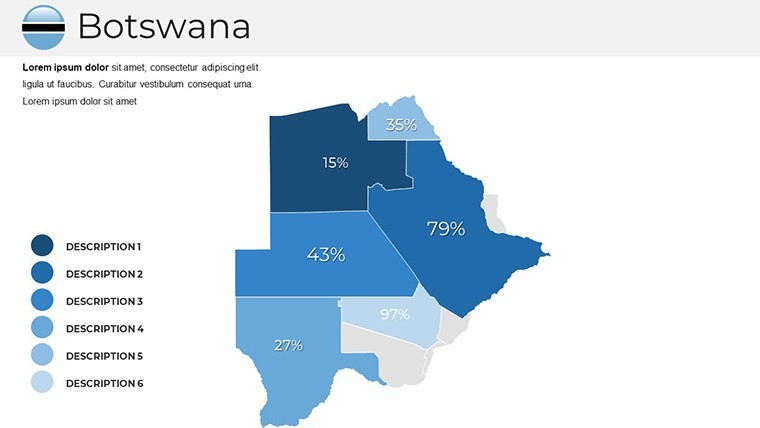
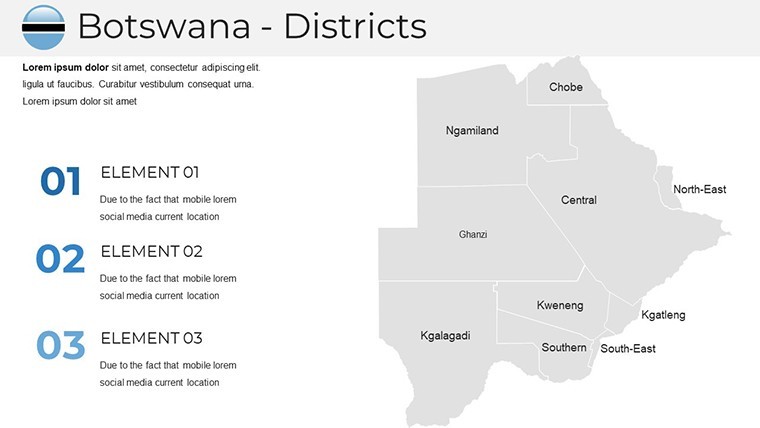
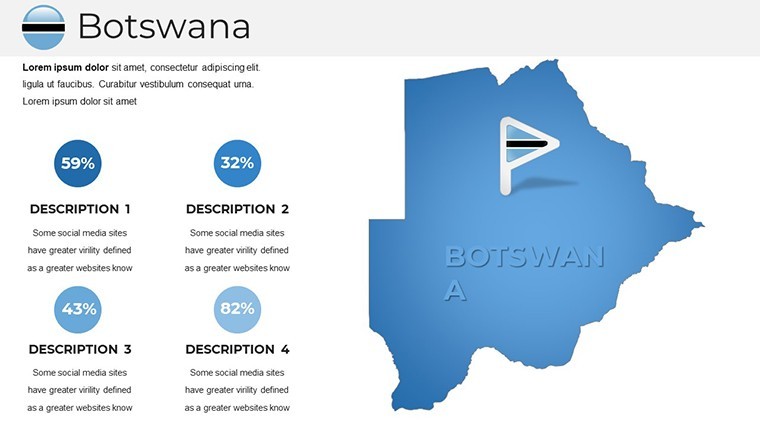
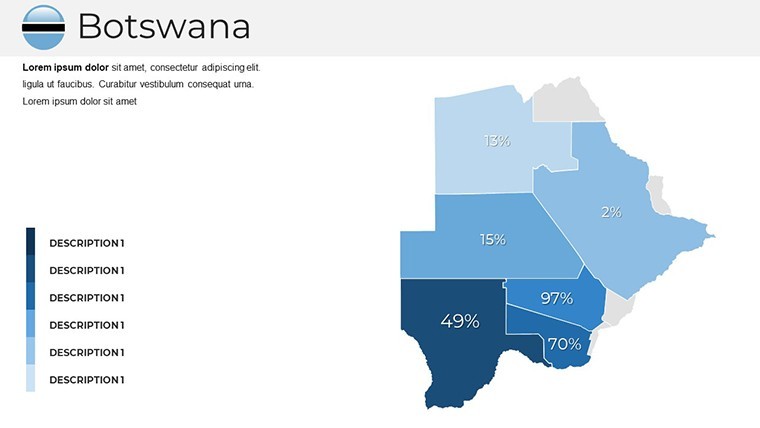
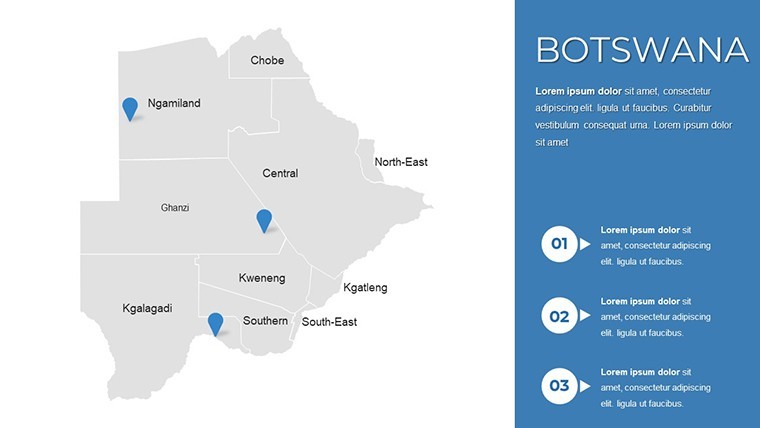
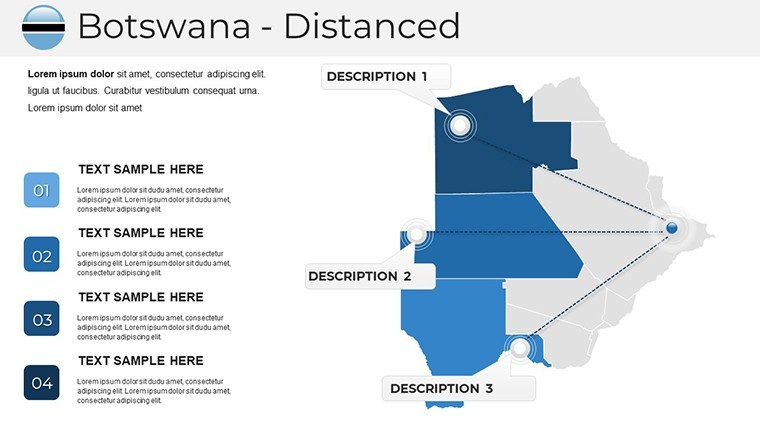
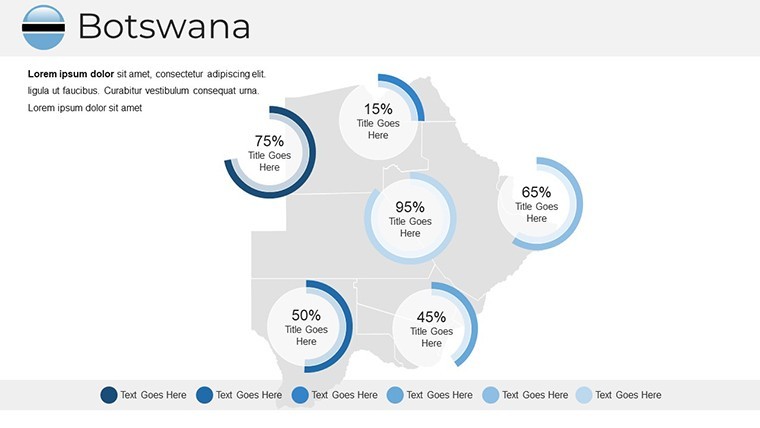
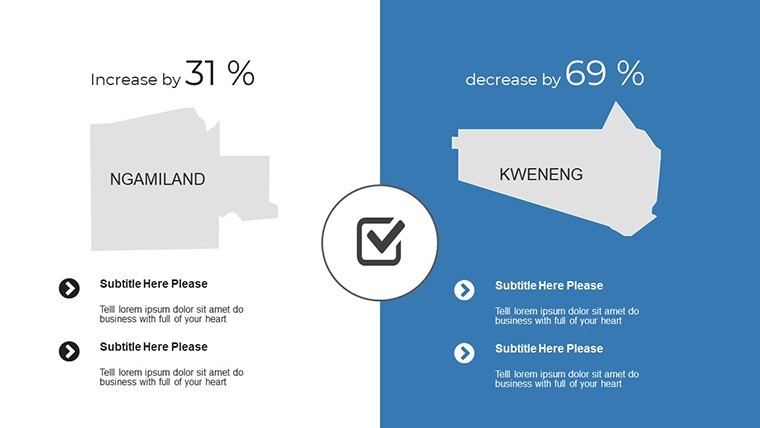
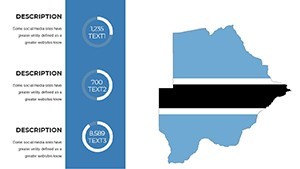
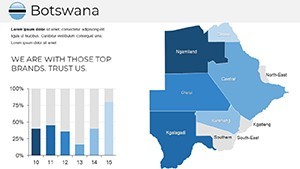
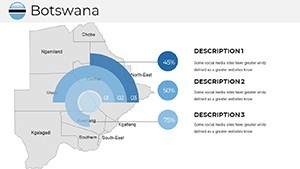
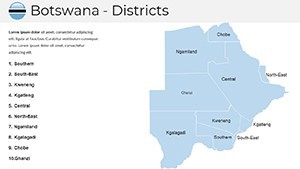
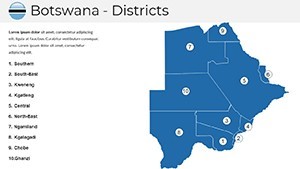
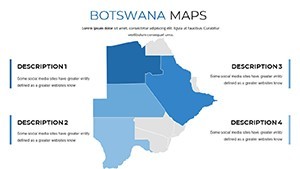
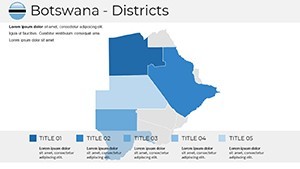
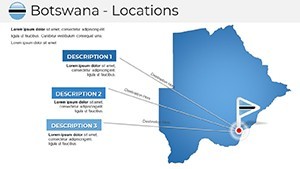
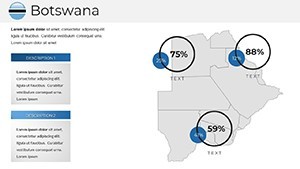
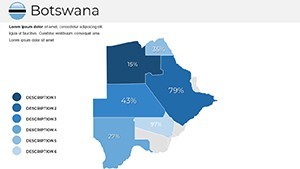
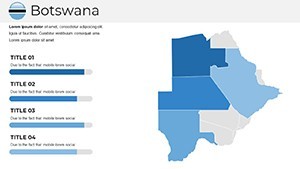
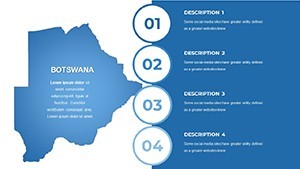
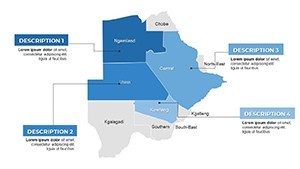
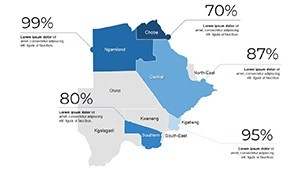
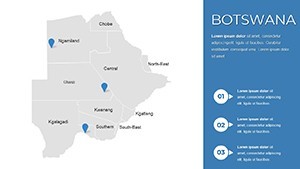
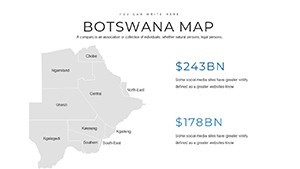
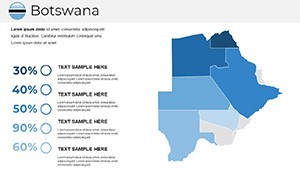
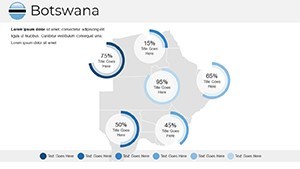
Map types across the 37 slides include full-country political overviews, district-level breakdowns, and blank outline versions suited for data overlays. Infographic placeholders sit alongside each map - bar chart frames, callout boxes, and icon anchor points - so geographic context and supporting data share the same slide without requiring a separate layout.
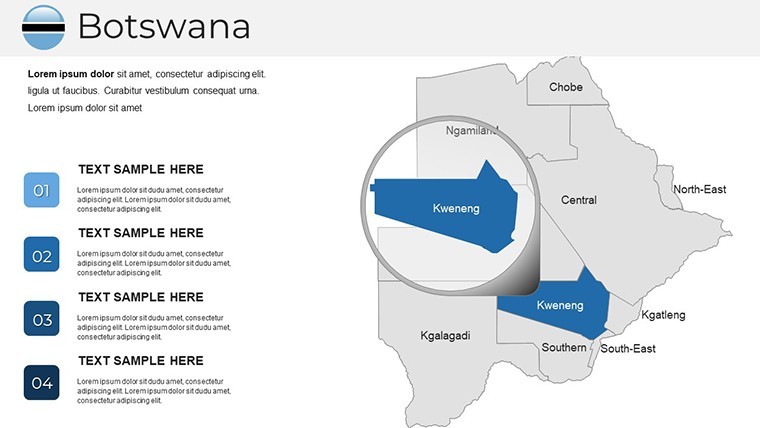
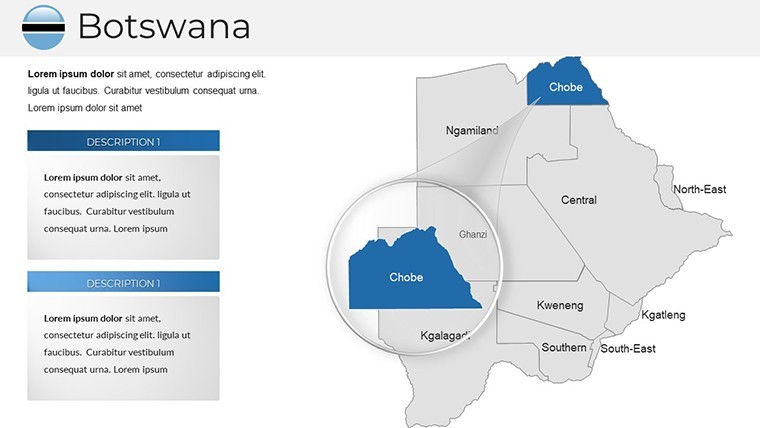
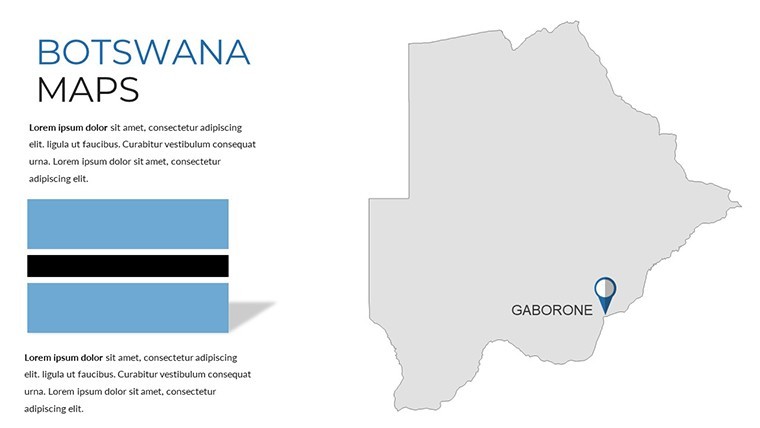
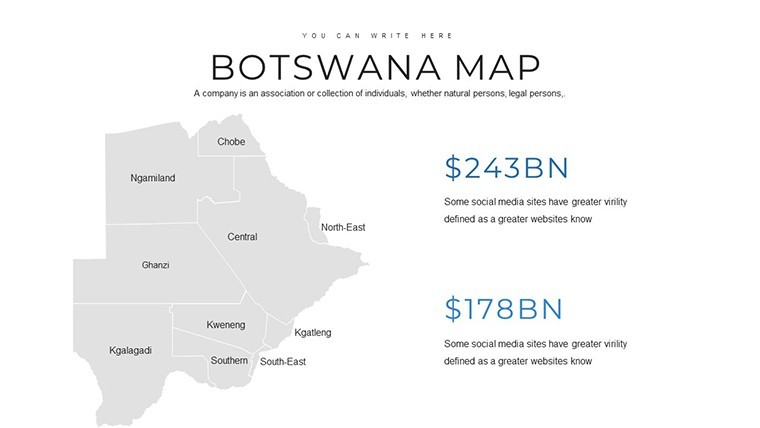
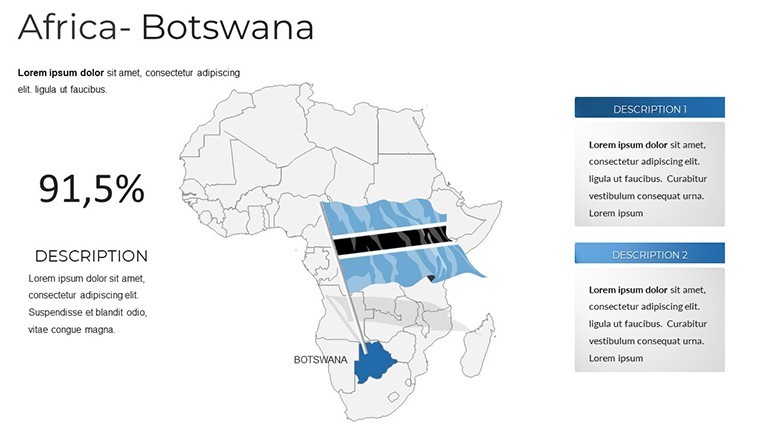
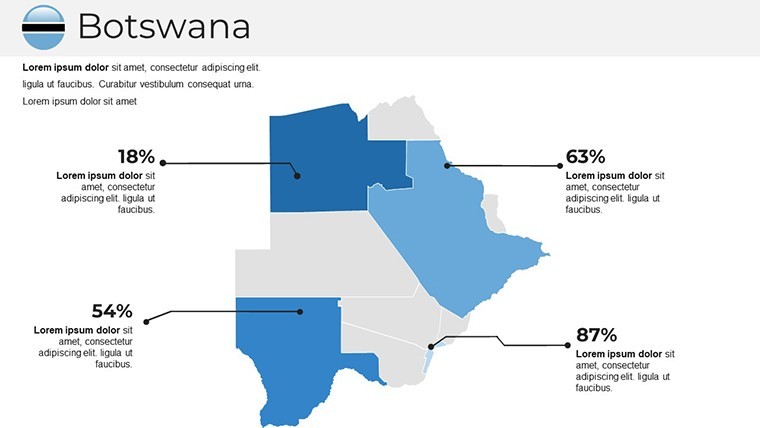
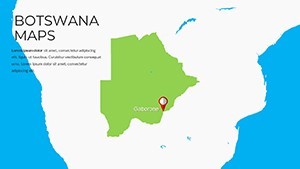
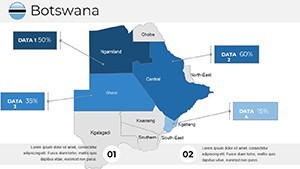
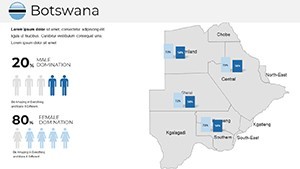
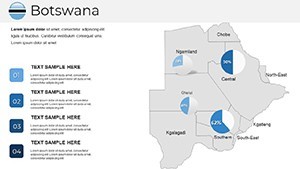
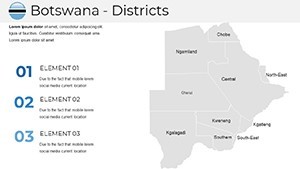
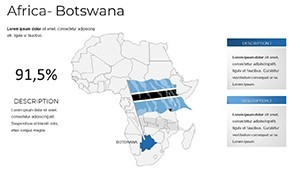
Unlike continent-level sets that give Botswana a single thumbnail among dozens of neighboring countries, every slide here focuses exclusively on Botswana's territory. Labels cover major cities including Gaborone and Francistown, district names, and border indicators - detail density that a regional analyst or investment strategist needs without building it manually.
Editing Capabilities at a Glance
| Feature | Details |
|---|---|
| Region shapes | Each district is an independent vector object - recolor or resize without affecting adjacent regions |
| Text placeholders | City and district labels update directly; no ungrouping required |
| Color theme adjustment | Apply brand colors via Keynote's master slide palette; all map fills inherit the change |
| Infographic frames | Chart and callout placeholders accept custom data without repositioning |
| File format | .key - opens in Keynote 12 or later on macOS and iPadOS |
| Aspect ratio | 16:9 widescreen standard |
| Export options | .key for continued editing; PDF or image export for distribution |
From Strategy Decks to Boardroom Pitches
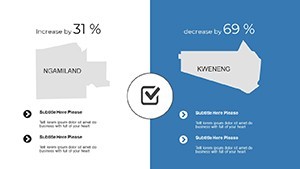
A regional sales director at a consumer goods company preparing for a Southern African distribution review used country-level political slides to map active territories against proposed expansion zones. Swapping district fill colors to represent sales tiers cut deck preparation from roughly three hours to under an hour, and the same file was reused across two subsequent quarterly briefings by updating only the data callouts.
An environmental consultant presenting land-use findings to a Gaborone government body relied on the blank outline slides to overlay resource extraction boundaries, combining the map shapes with Keynote's native charting tools. The geographic accuracy of the district shapes meant no manual correction of border lines - a task that typically adds 45 minutes to any presentation built from scratch in a generic design tool.
Educators running geography seminars find the thematic blank variants particularly practical. One university lecturer adapted the same base file for five consecutive modules - demographic distribution one week, economic zones the next - by duplicating slides and changing only the overlay layer. No new file, no rebuilding.
Download and start editing immediately - every region shape is ready for your data.
Customization in 5 Steps
Adapting the file to a specific project takes under 20 minutes for most use cases. Difficulty level: Beginner.
- Step 1 - Open the .key file in Keynote 12 or later (1 minute)
- Step 2 - Choose a base map slide matching your coverage need: full country, district breakdown, or blank outline (1 minute)
- Step 3 - Apply brand colors through the master slide palette; region fills update automatically (3 minutes)
- Step 4 - Replace placeholder text with location names, data values, or callout copy (5 minutes)
- Step 5 - Export as .key to share the editable file, or as PDF for distribution (1 minute)
One practical note on color: map regions read most clearly when adjacent districts carry colors from the same hue family at different lightness values, rather than unrelated colors. Keynote's built-in palette makes this straightforward - pick a base color, then use the tint slider for neighboring regions. The Keynote Maps category contains additional country and regional sets that follow the same editing logic if you need to expand coverage.
Why This Template, Not a Blank Slide
Building an accurate Botswana district map from scratch in Keynote requires sourcing a reliable outline, converting it to editable shapes, verifying boundary accuracy, and then constructing placeholder layers for text and infographic elements. That process takes an experienced designer between two and four hours. Without a geographic reference file, the risk of inaccurate district boundaries is real - a visible error in a boardroom or client proposal undermines the credibility of the entire deck.
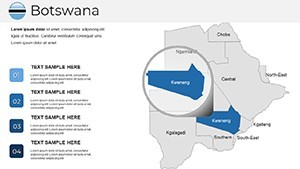
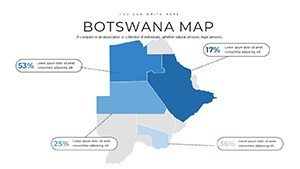
Region labels in this file are placed outside the map shapes, connected by thin leader lines. That layout choice exists for a practical reason: on projection screens in mid-sized conference rooms, text placed inside small district shapes becomes illegible past roughly eight meters. External labels with connector lines stay readable at any viewing distance without requiring a font size increase that would otherwise crowd the slide.
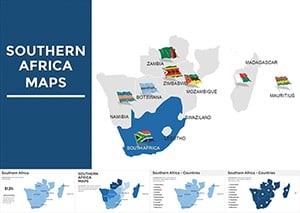
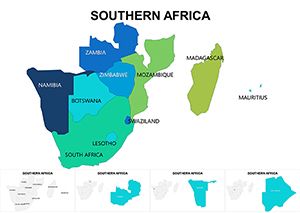
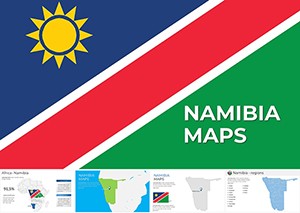
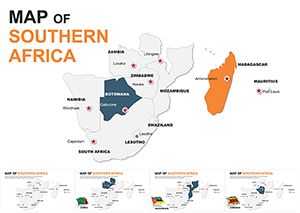
Analysts who need to pair this country view with a broader regional context can combine it with a Southern Africa Keynote Maps set - the color conventions and slide dimensions are consistent, so merging slides from both files into a single deck requires no reformatting. A complementary option for adjacent coverage is the Namibia Keynote Maps set, which covers the neighboring territory at the same level of district detail.
Download and start editing immediately.
Which version of Keynote is required to open this file?
The .key file is compatible with Keynote 12 and all later versions on macOS and iPadOS. Keynote 12 was released in 2021 alongside macOS Monterey, so any Mac running Monterey, Ventura, or Sonoma will open the file without compatibility issues. Earlier Keynote versions may display shape formatting differently, so updating to at least version 12 before opening is recommended. iCloud Keynote (browser-based) can open the file for viewing but has limited shape-editing capabilities compared to the desktop app.
How do I change the color scheme to match my brand?
Open the file in Keynote, then navigate to View > Edit Master Slides. Select the master associated with the map layouts and update the fill colors for each region placeholder. Changes made at the master level propagate to all slides using that master, so a single adjustment covers the full set. For individual district recoloring, click the region shape directly, open the Format panel, and change the fill color independently. This two-level approach - master palette for global brand alignment, individual fills for data-specific color coding - covers most use cases without requiring advanced design skills.
Can I use this template in paid client work?
The license covers personal use and internal business presentations. Use in paid client deliverables - for example, a consultant including these slides in a report billed to a client - requires reviewing the ImagineLayout terms of use, as commercial client work may fall under a different license tier. Reselling the template file itself, redistributing the .key file as a standalone product, or sublicensing it to third parties is not permitted under any license tier. For any licensing questions specific to your use case, contacting ImagineLayout support directly will provide the most accurate answer.
Does the file include animation support?
The template ships without pre-set animations so that the file opens cleanly for users who prefer static slides. Adding animations in Keynote is straightforward: select any region shape or text element, open the Animate panel, and choose a build-in or build-out effect. For map presentations, a sequential "appear" build applied to district shapes - triggered by click - works well for revealing regions one at a time during a live briefing. Build order is set in the Build Order panel and can be rearranged by dragging. Removing animations later follows the same process: open Animate, select the effect, and delete it.
What is the refund policy if the file does not work as expected?
ImagineLayout's refund policy covers purchases where the delivered file does not match the product description or is technically non-functional on a supported version of Keynote. Because the file is a digital download, refunds are not issued for subjective reasons such as a change of preference after purchase. If the file fails to open in Keynote 12 or later, or if the slide count does not match the listed 37 slides, contacting support with a description of the issue and the order confirmation is the correct first step. The full refund policy is available at imaginelayout.com/refund-policy.