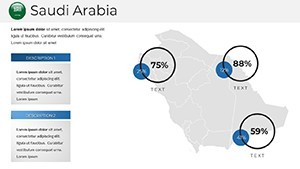
Saudi Arabia Keynote Maps Template: Professional Cartography at Your Fingertips


Type: Keynote Maps template
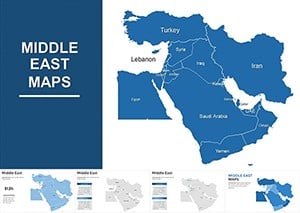
Category: Middle East
Sources Available: .key
Product ID: KM00206
Template incl.: 38 editable slides
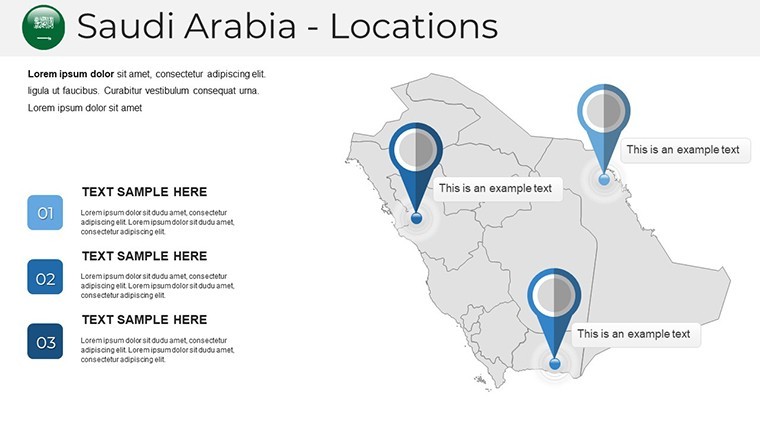
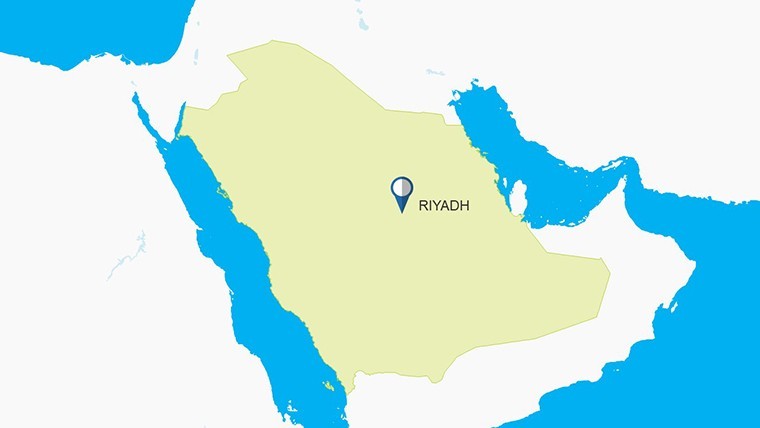
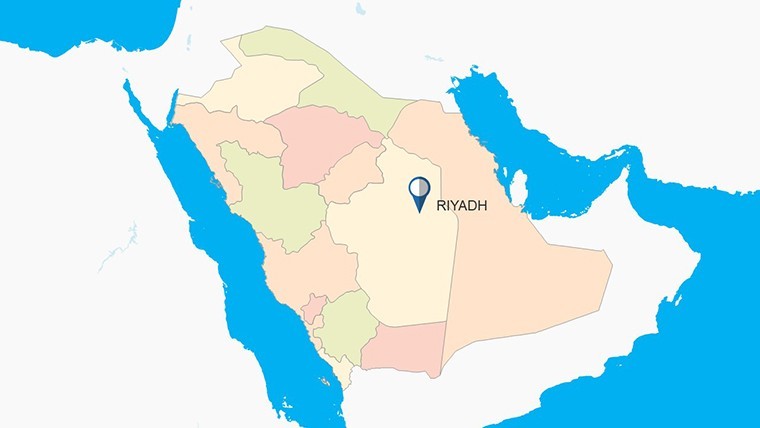
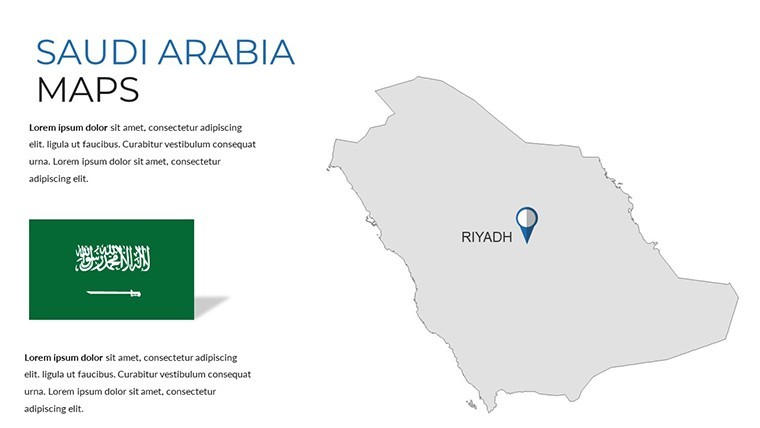
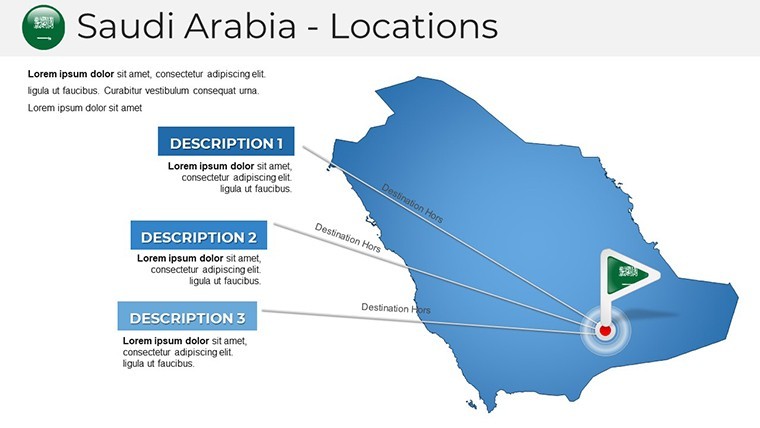
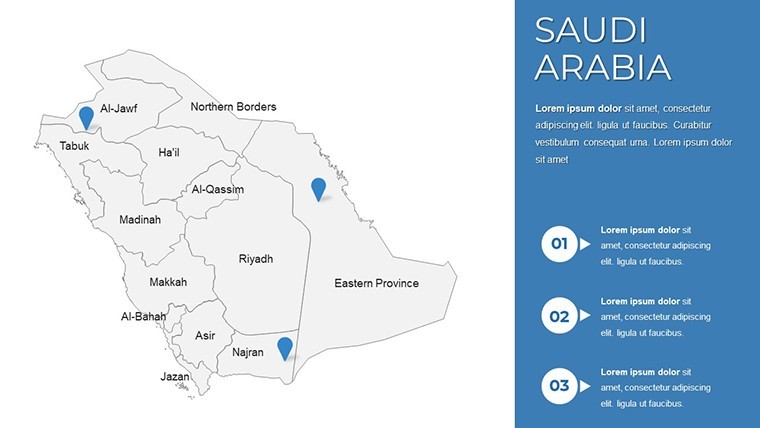
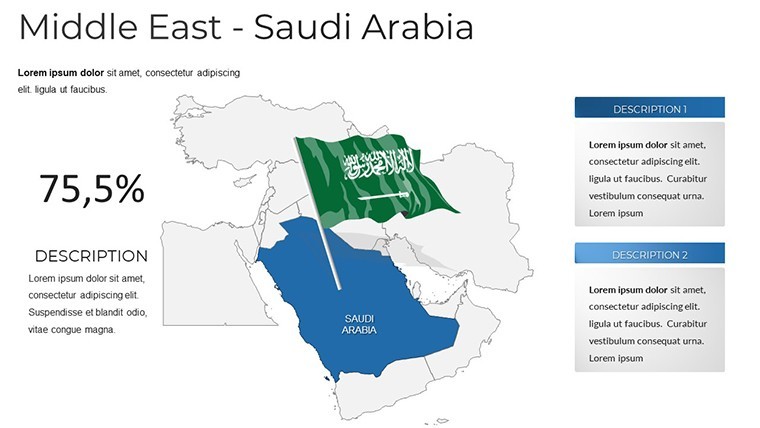
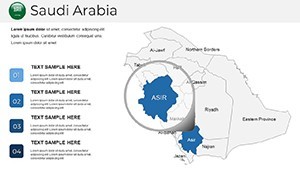
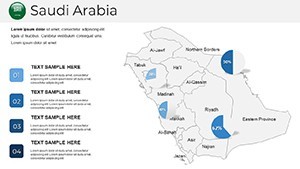
In an era where data drives decisions, mapping tools are essential for conveying territorial insights effectively. Our Saudi Arabia Keynote Maps Template caters to strategists, educators, oil industry experts, and tourism professionals seeking to depict the Kingdom's vast deserts, key cities like Riyadh and Jeddah, or sacred sites in Mecca and Medina. Boasting 38 editable slides in .key format, this template is built for Apple's Keynote, offering vector symbols that scale flawlessly for detailed presentations on economic hubs or environmental challenges.
This resource turns abstract concepts into tangible visuals, ideal for boardroom pitches on Saudi Vision 2030 or academic lectures on Arabian Peninsula geography. By providing handcrafted maps with custom animations, it alleviates the hassle of manual design, letting you emphasize analysis over aesthetics. Backed by cartographic standards from bodies like the International Cartographic Association, it ensures authoritative, engaging content that resonates with diverse audiences.
Standout Features for Dynamic Mapping
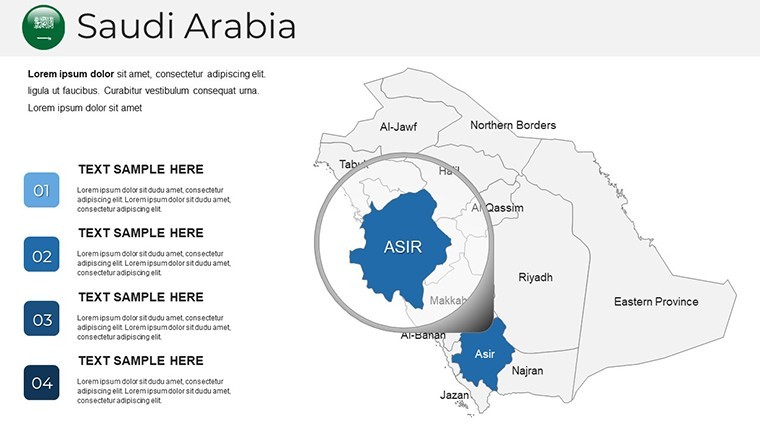
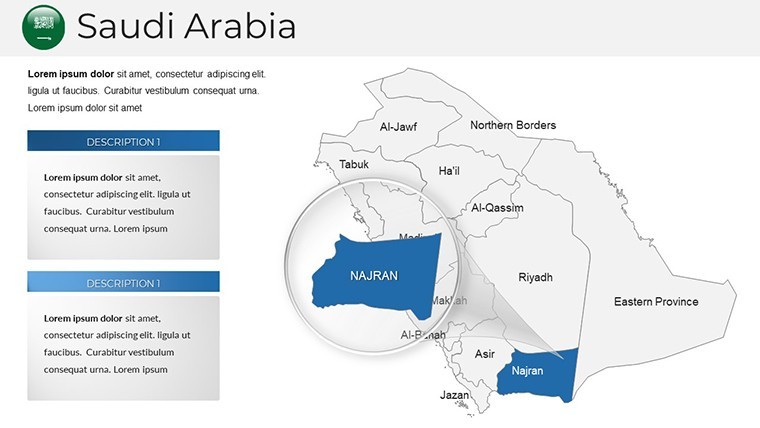
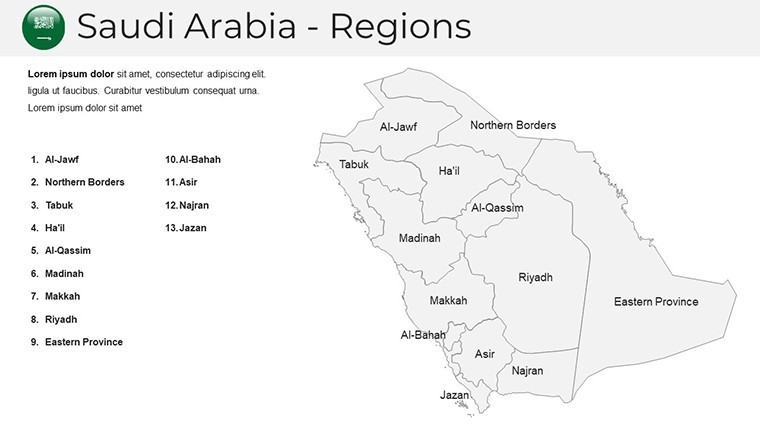
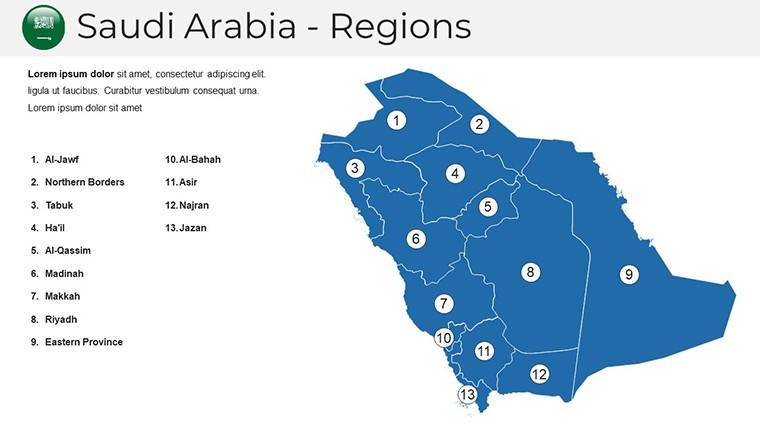
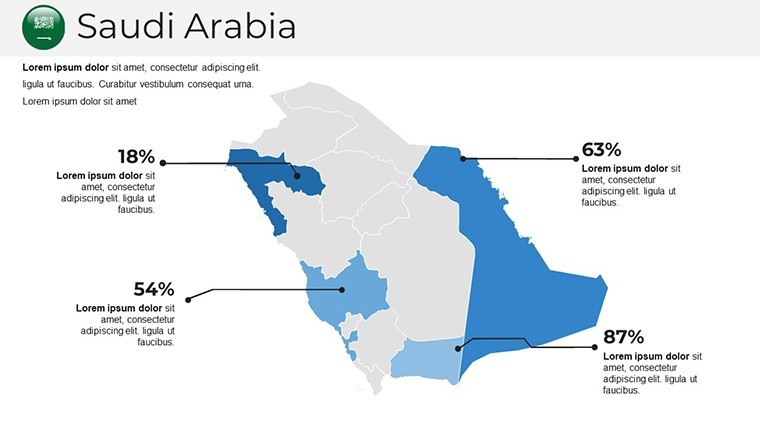
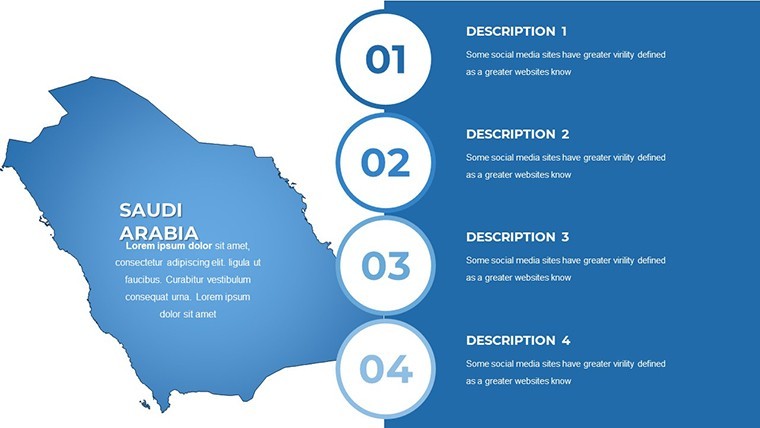
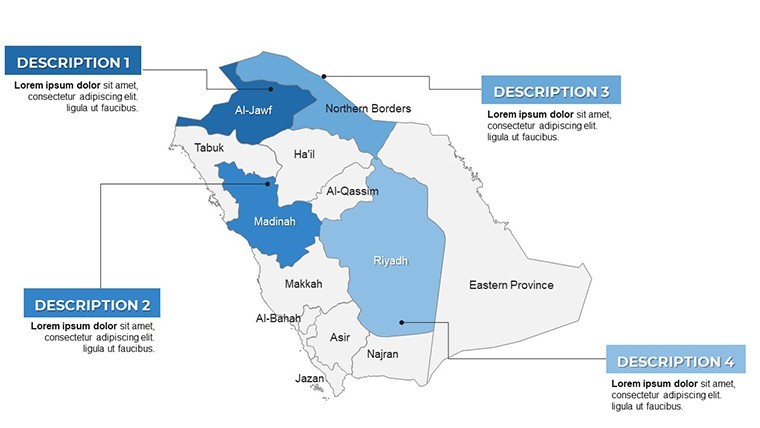
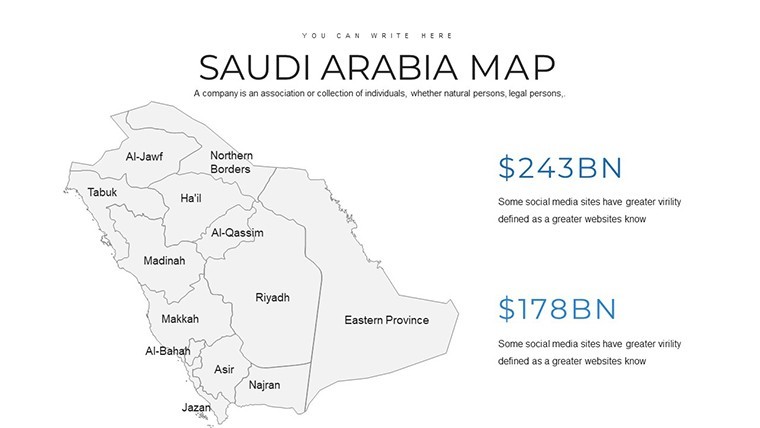
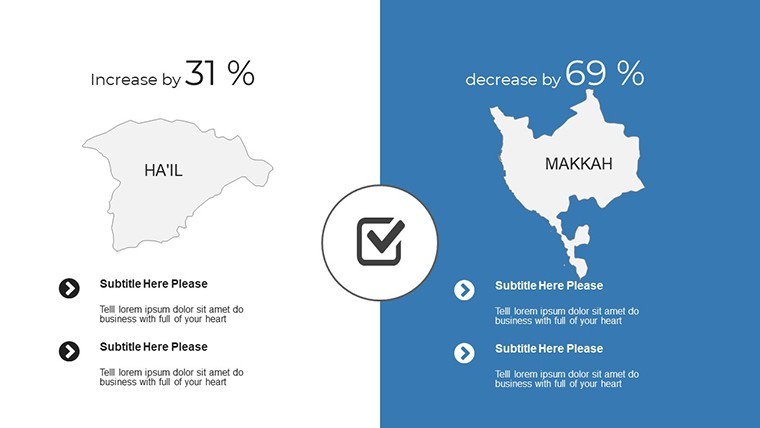
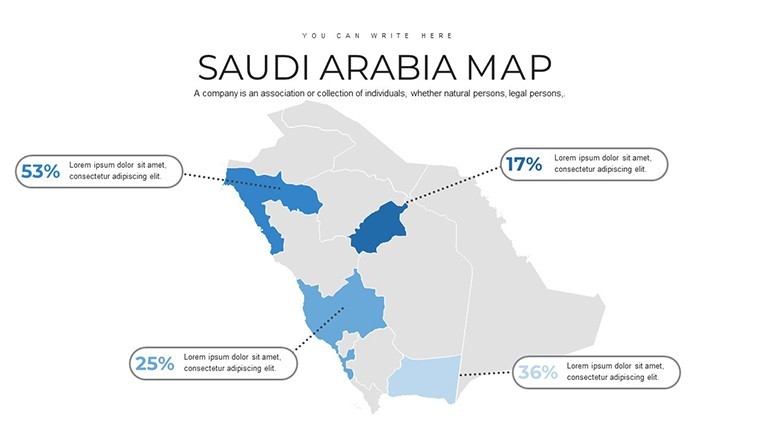
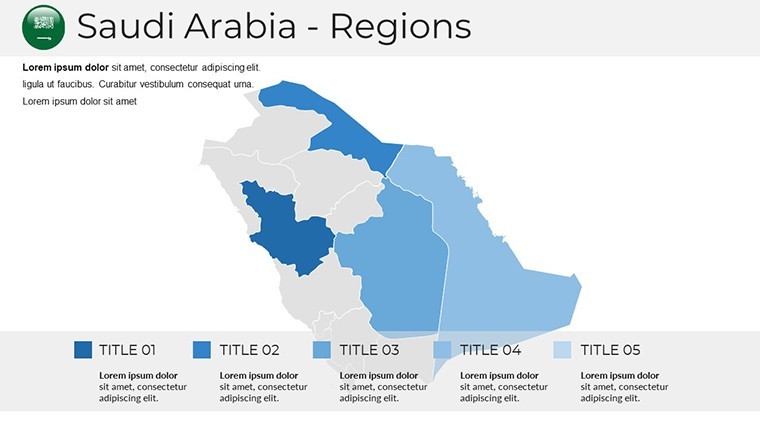
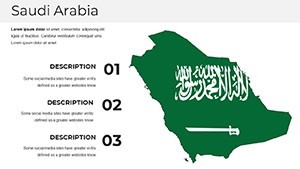
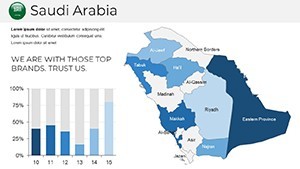
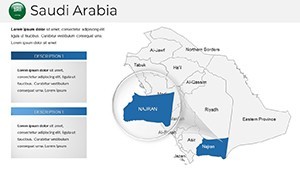
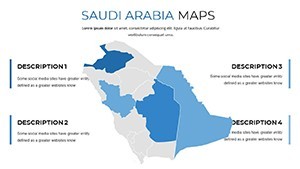
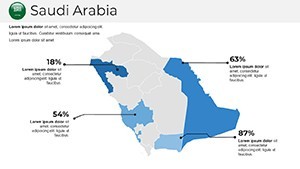
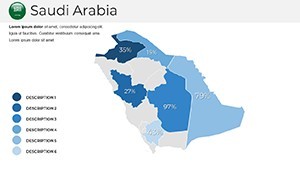
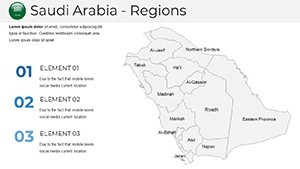
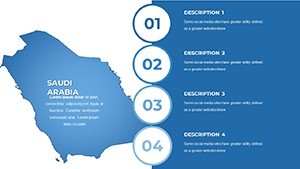
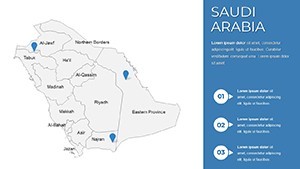
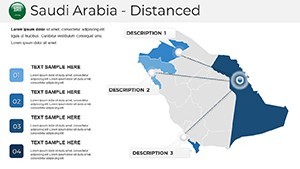
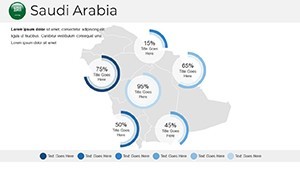
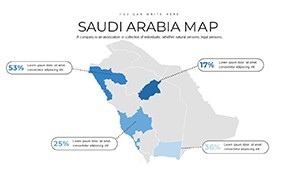
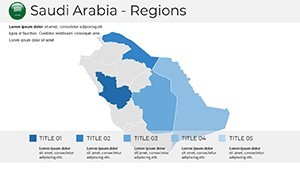
Explore features that elevate your slides. The 38 slides include political, editable maps with regions like the Eastern Province or Asir, all vector-based to prevent pixelation. Custom animations per object allow sequential reveals, while section breaks structure long decks efficiently.
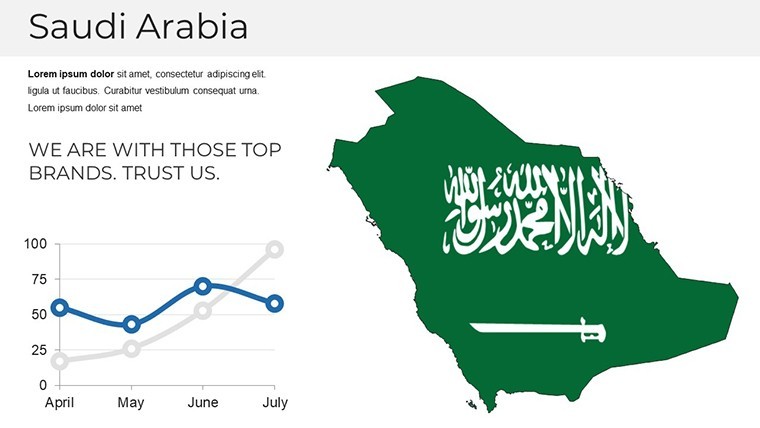
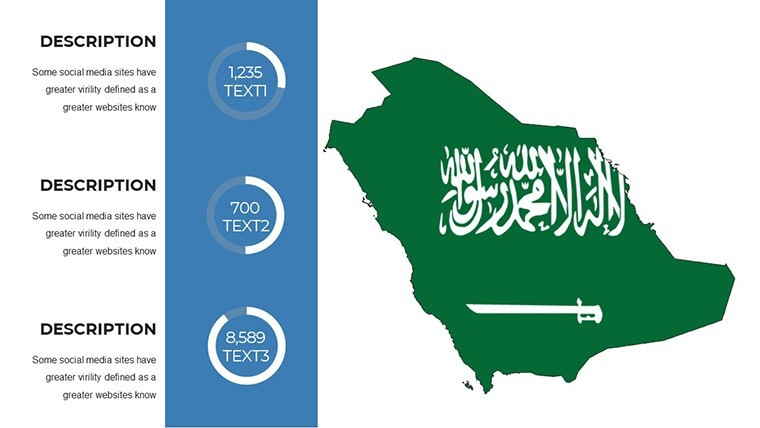
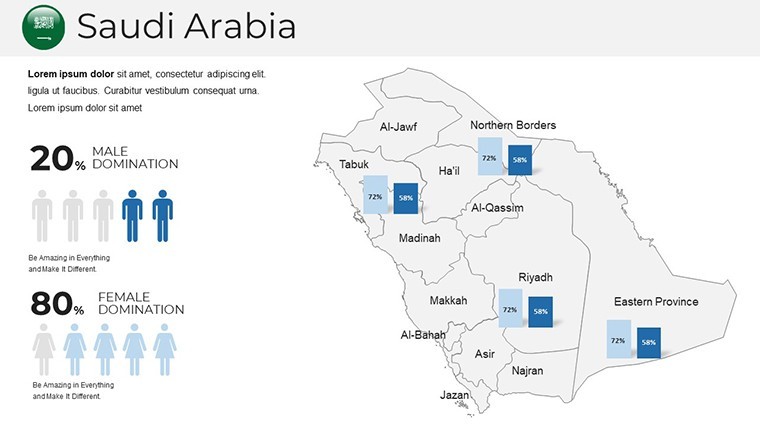
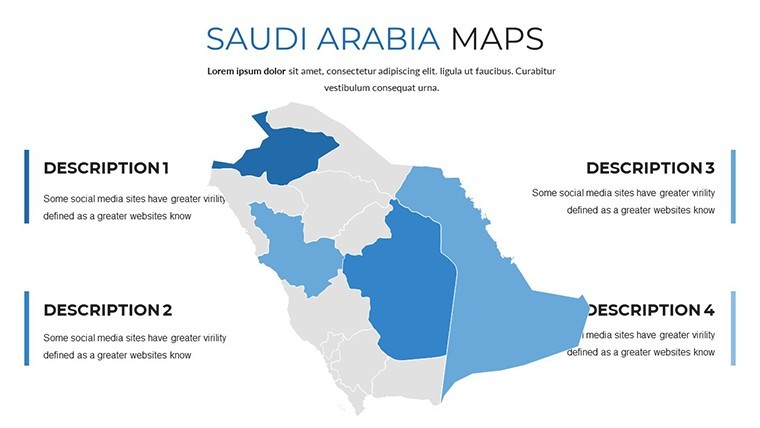
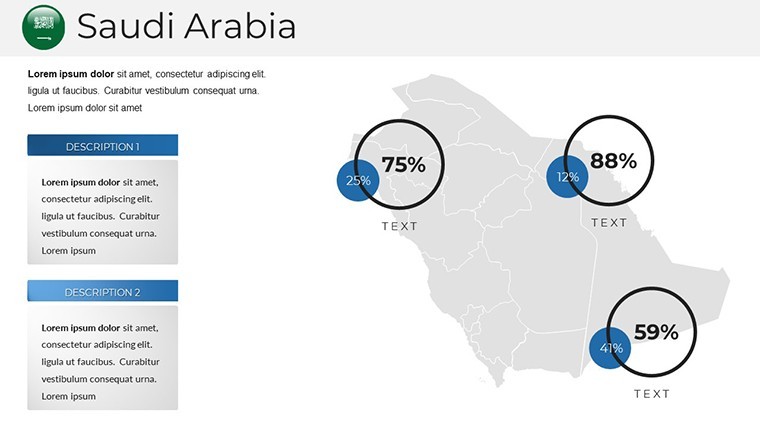
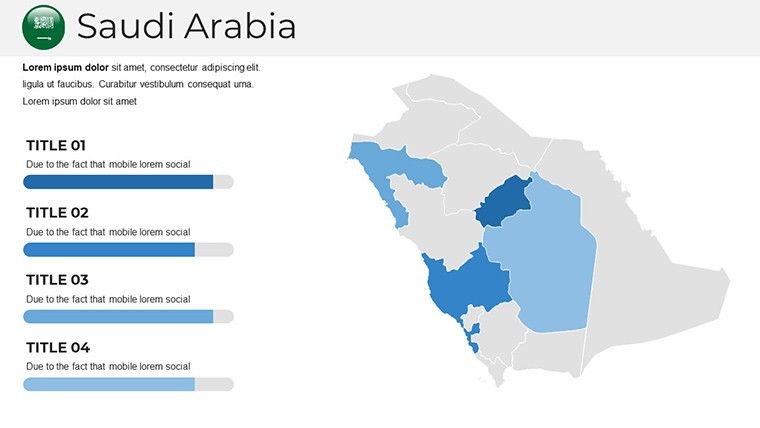
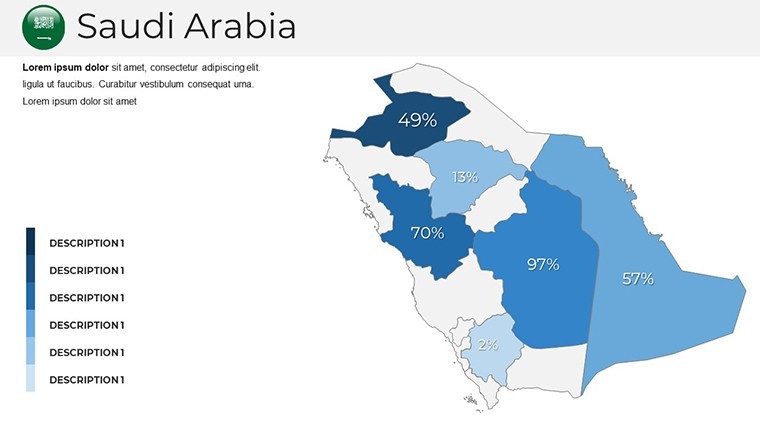
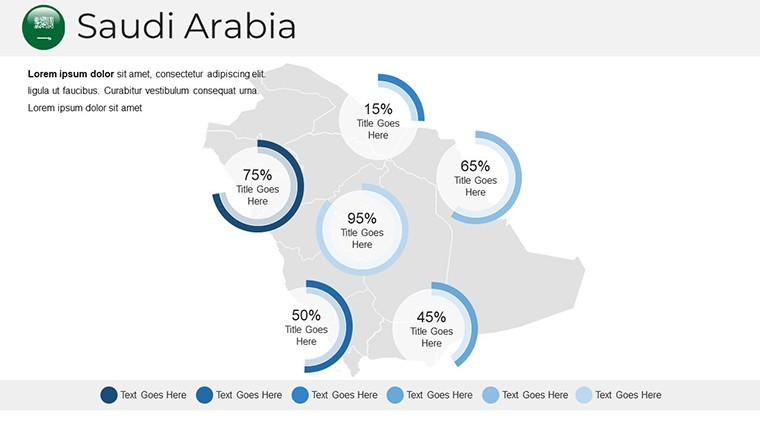
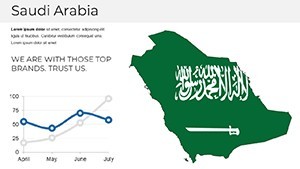
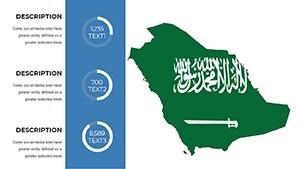
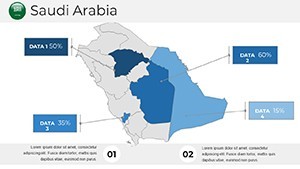
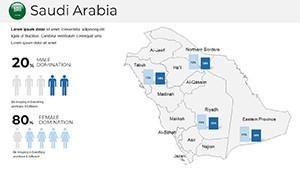
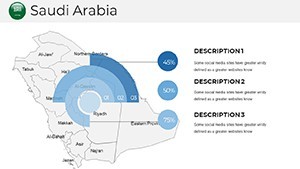
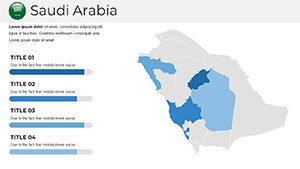
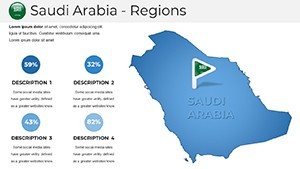
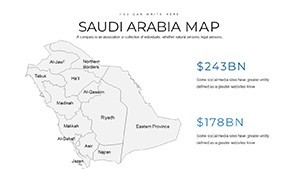
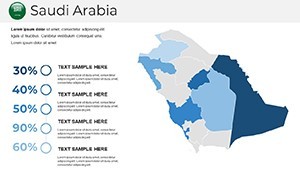
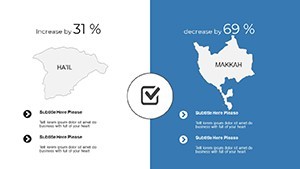
A clean professional style incorporates free fonts and handmade infographics for overlaying metrics like GDP or population density. Wide-screen compatibility suits modern displays, and documentation guides quick mastery.
- 38 slides with varied map configurations
- Vector elements for high-quality edits
- Object-specific animations
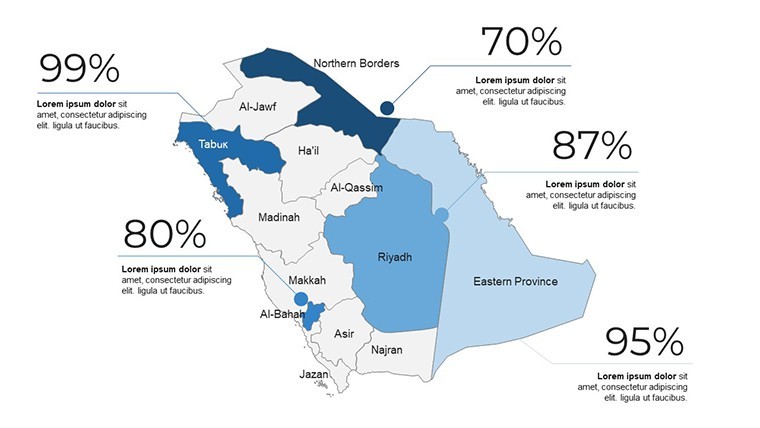
- Infographics for data visualization
- Included quick guide and docs
Strategic Benefits for Your Projects
This template delivers efficiency gains, reducing prep time for maps that would otherwise require GIS software. Benefits include heightened clarity - visuals aid 65% better retention, per visualization research from MIT. For authority, accurate projections mirror real-world data from sources like Saudi Geological Survey.
In practice, it builds trust in presentations, such as energy sector reports on Aramco operations, where precise mapping underscores expertise. Users report smoother collaborations, with iOS integration enabling on-the-go tweaks.
Applications in Varied Scenarios
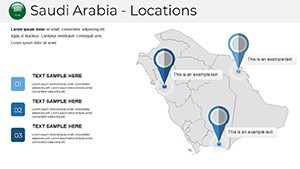
Visualize a business analyst mapping investment zones in NEOM for stakeholders, using animations to highlight infrastructure - resulting in accelerated funding. Or a historian illustrating Hajj routes, engaging pilgrims with interactive elements.
Tourism boards promote heritage sites, integrating photos via infographics for compelling proposals. A case from a Dubai-based firm: Utilized similar maps for a market entry strategy, crediting visuals for clinching a partnership. Environmentalists map Red Sea conservation areas, advocating policies at conferences like COP.
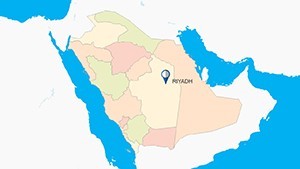
Government advisors use it for urban planning, detailing Riyadh's metro expansions. The adaptability shines in crisis management, like plotting relief efforts in flood-prone areas.
Customization Workflow Made Simple
Effortless editing starts here. Import into Keynote, then modify: Double-click shapes to recolor via the format pane, resize without distortion.
- Load the template in Keynote.
- Select a regional map slide.
- Edit colors, fonts, and sizes.
- Add grids or tick marks as needed.
- Insert infographics for data.
- Apply transitions for polish.
- Save and share via iCloud.
Combine with apps like Numbers for data import, streamlining complex builds.
Pro Tips for Cartographic Excellence
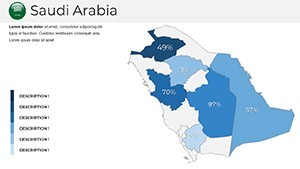
Opt for thematic maps to convey specifics, like heatmaps for oil reserves. Use legible fonts and colors for inclusivity. Layer elements thoughtfully to avoid clutter.
Test animations for pacing; subtle effects enhance without distracting. Reference ICA guidelines for ethical mapping. Update with satellite imagery trends for currency in Saudi-focused talks.
Foster audience interaction by exporting to PDF for handouts. Monitor feedback to refine future uses.
Frequently Asked Questions
Can I edit maps on iPad? Yes, fully compatible with iOS Keynote for mobile editing.
Are vectors resolution-independent? Absolutely, ensuring sharp prints or zooms.
Does it include animations? Yes, customizable per object for engaging flows.
How accurate are the maps? Based on standard political and geographic data; cross-check for updates.
Can I add my data? Easily, via integrated infographics and charts.