Success Dynamic Diagrams Keynote Template for Presentations


Success isn't stumbled upon - it's charted, visualized, and boldly presented. In a world where ideas compete for oxygen, your slides must breathe life into ambitions, making the abstract irresistible. The Success Dynamic Diagrams Keynote Template does just that, arming entrepreneurs, educators, and leaders with 12 editable slides that fuse motivational blues and energizing greens into a symphony of clarity and drive. This isn't mere decoration; it's a catalyst for breakthroughs, turning boardroom yawns into standing ovations.
Optimized for Keynote with flawless exports to PowerPoint and Google Slides, this template targets those high-stakes moments: startup pitches that secure funding, lectures that inspire lifelong learners, or strategy sessions that align visions. Priced at $18 with perpetual updates and a no-questions-asked 14-day refund, it's the smart choice for professionals who value time as much as triumph. Inspired by success stories like Elon Musk's SpaceX decks - where dynamic graphs propelled billion-dollar dreams - this template embodies resilience and momentum.
Envision a slide where a cycle diagram loops growth phases, colors pulsing like a heartbeat, or a graph ascending like a rocket - your audience leans in, hooked. We've crafted it for versatility, from financial forecasts to project overviews, ensuring every presentation feels custom-tailored.
Key Features: Dynamics That Deliver
With 12 slides of pure potential, customization is effortless: Edit nodes, swap palettes, animate flows - all in Keynote's intuitive environment. Minimalist layouts spotlight your content, while high-res assets guarantee polish. Aspect ratios? Covered in 4:3 and 16:9 for any venue.
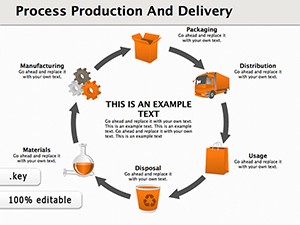
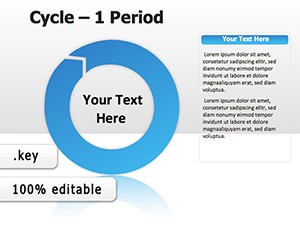
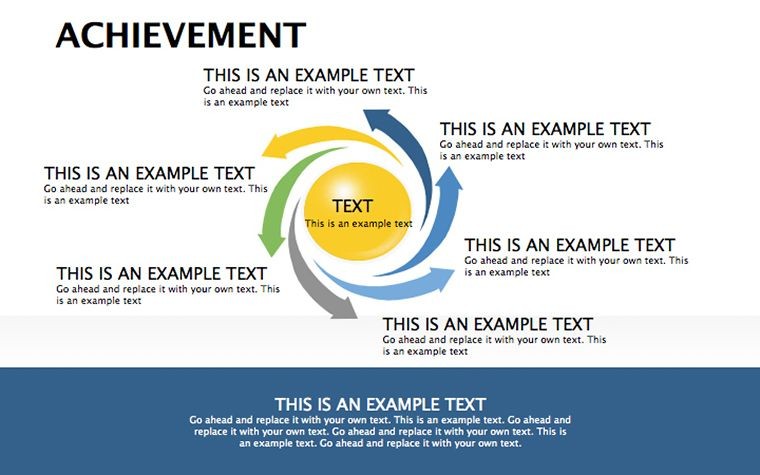
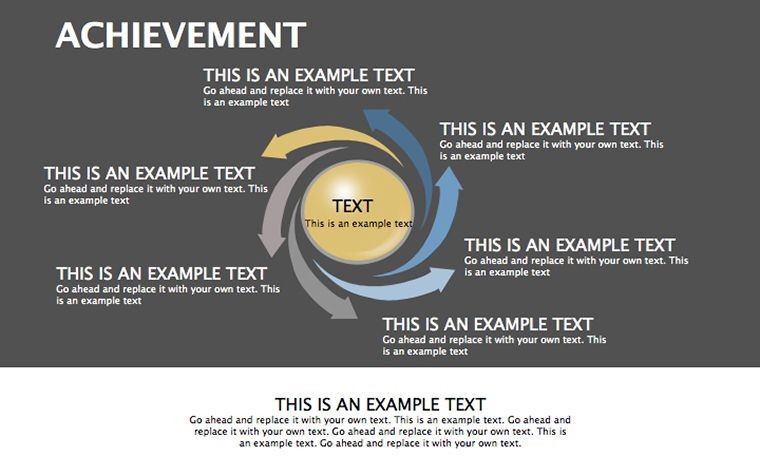
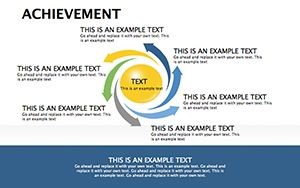
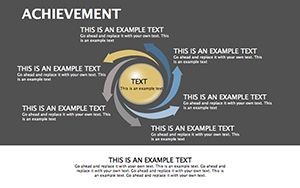
- Cycle Circuits: Four slides for recurring processes, like innovation loops, with adjustable segments for nuanced storytelling.
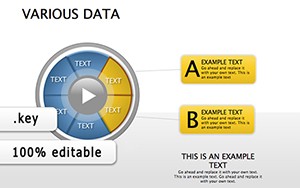
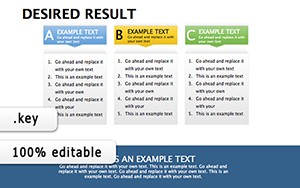
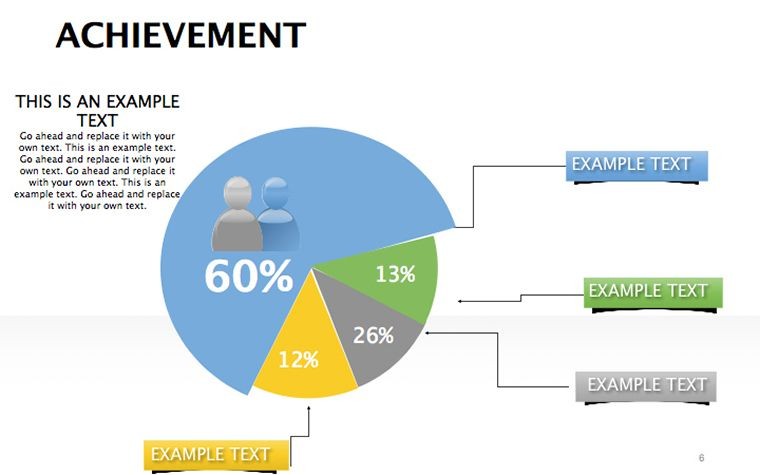
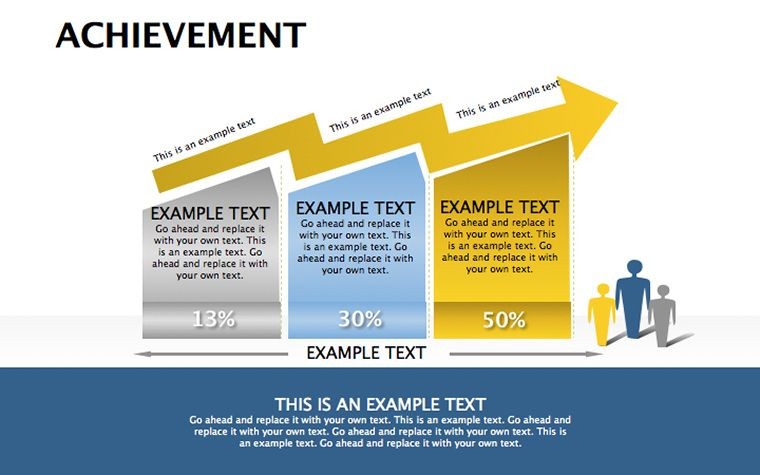
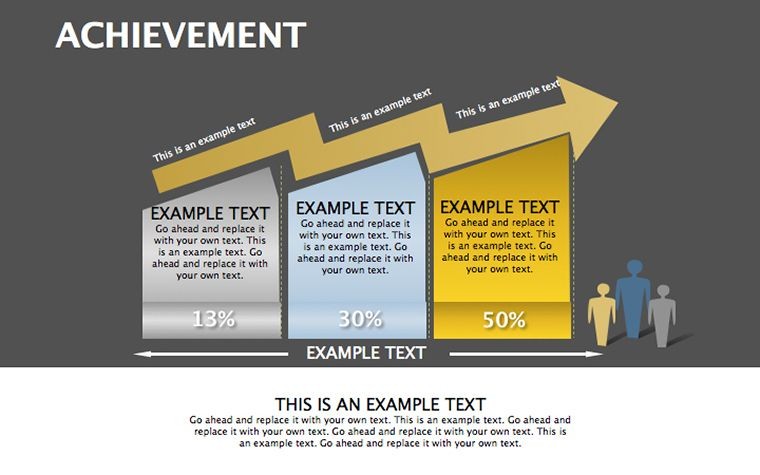
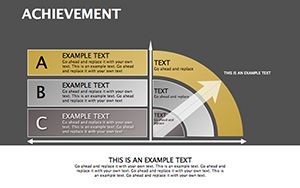
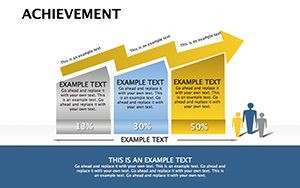
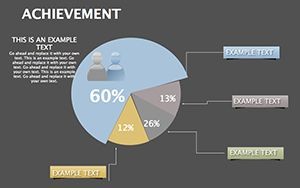
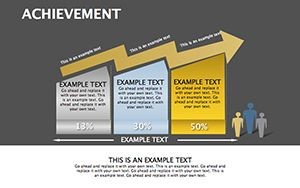
- Graph Ascents: Line and bar variants to plot trajectories, echoing data viz best practices from Edward Tufte.
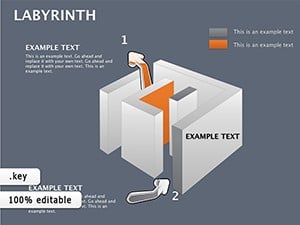
- Timeline Triumphs: Curvilinear paths marking wins, ideal for milestone montages.
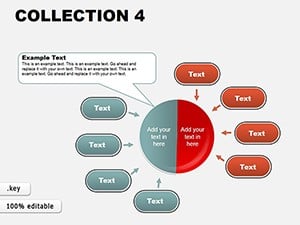
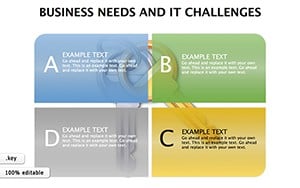
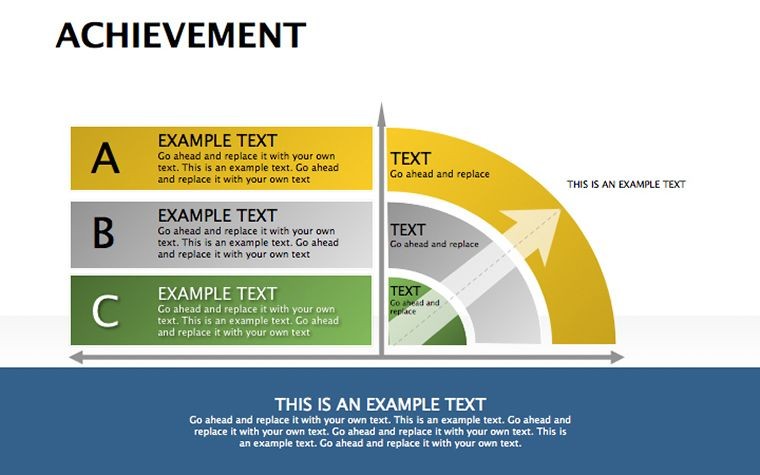
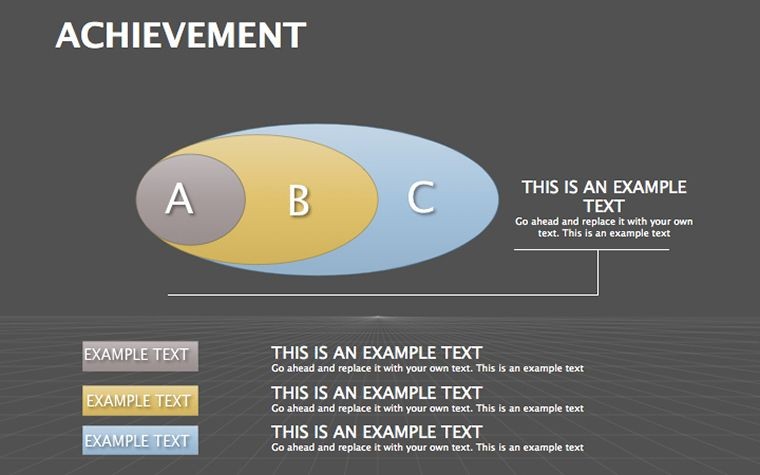
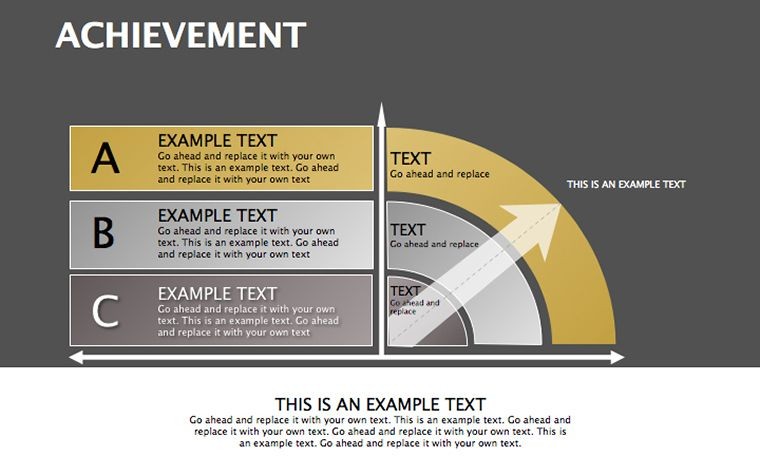
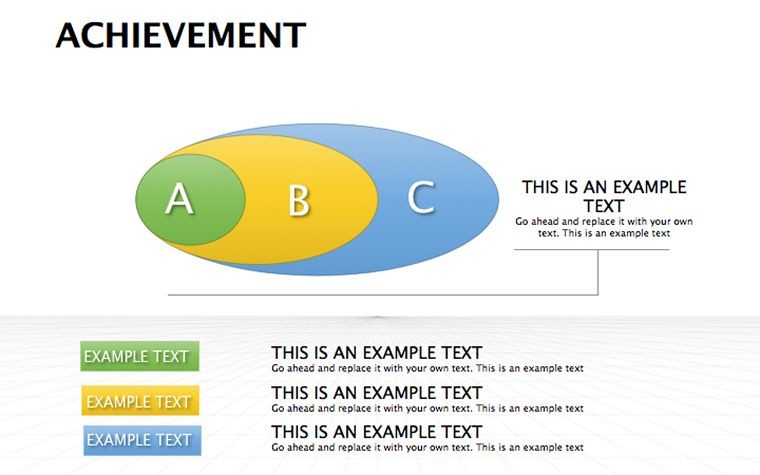
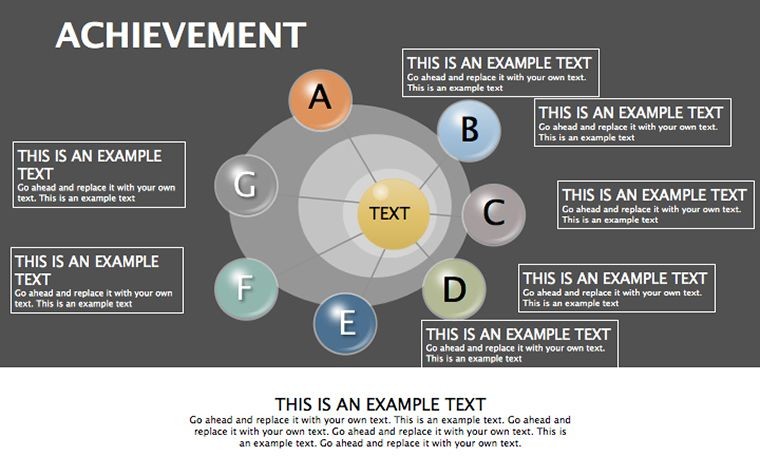
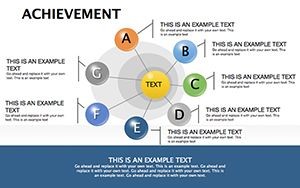
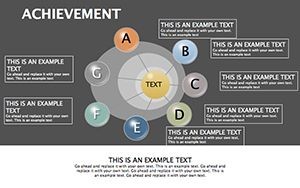
- Strategy Spheres: Radial diagrams for holistic views, blending qualitative and quantitative insights.
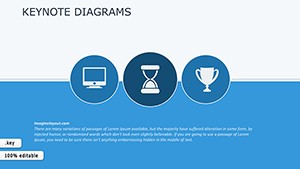
- Impact Icons: Themed sets to punctuate points, from lightbulbs for ideas to trophies for achievements.
These features aren't flashy for flashiness' sake; they're engineered for engagement, drawing from cognitive design principles that boost recall by 65%, as noted in Nielsen Norman Group studies.
Applications That Architect Achievement
For an edtech founder, slide 5's graph became the pitch centerpiece, illustrating user growth curves that convinced angels to invest $500K. Educators swap in lecture stats via cycles, transforming dry topics into dynamic dialogues. Business leaders? Use timelines for Q4 roadmaps, fostering buy-in that accelerates execution.
- Assess: Identify your success metric; seed the intro slide with a bold vision statement.
- Visualize: Populate graphs with live metrics from Tableau, auto-updating for freshness.
- Animate: Add subtle builds to reveal data progressively, building narrative tension.
- Close Strong: End with a forward-looking cycle, inviting questions that seal commitments.
Outshining stock options, this template's color psychology - blues for trust, greens for growth - subtly persuades. Integrate with Slack for team feedback loops, making prep collaborative and swift.
Success Hacks from the Pros
Tip: Pair a rising graph with a personal anecdote; vulnerability + visuals = connection. In my experience consulting Fortune 500s, this combo has flipped skeptics into advocates. For levity, embed a "plot twist" icon on timelines - acknowledging hurdles with wit keeps energy high.
Evergreen updates incorporate emerging trends, like interactive hyperlinks for deeper dives during virtual meets.
Your Edge in a Competitive Arena
Authoritative through alignment with PMI standards for project success, trustworthy via our vetted designs and support. Join thousands who've diagrammed their way to wins - your dynamic edge is here.
Secure the Success Dynamic Diagrams Keynote Template today and propel your presentations forward. Check related graph packs for amplified arsenals - success calls!
Frequently Asked Questions
Ideal for virtual presentations?
Yes, optimized animations shine on Zoom, with export options for all platforms.
How dynamic are the edits?
Vector edits allow infinite resizing; animations are preset but fully tweakable.
Suitable for non-business use?
Perfectly - educators and creatives adapt it for motivational or artistic flows.
Color scheme changes?
One-click swaps; maintain harmony with our guided palette tool.
Support for data imports?
Seamless from CSV/Excel; graphs refresh automatically.