Different Graphics Keynote Diagrams: Versatile Visuals for Every Presentation


Type: Keynote Diagrams template
Category: Graphs
Sources Available: .key
Product ID: KD00150
Template incl.: 14 editable slides
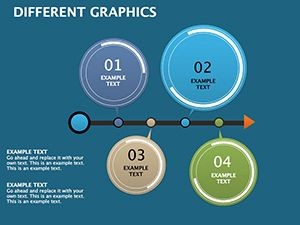
Ever stared at a blank Keynote slide, wondering how to make your data sing? Enter the Different Graphics Keynote diagrams template, a collection of 14 editable slides brimming with diverse diagrams to elevate your talks. Aimed at presenters from marketers to educators, this template offers an impressive array of graphics - graphs, charts, and more - that you can tweak in color and position for perfect fit. It's about more than visuals; it's solving the puzzle of engaging audiences with clear, compelling stories. Compatible with Keynote's ecosystem, including cloud collaboration, these diagrams cut design time, letting you focus on insights. Whether illustrating sales trends or educational concepts, the benefits are evident: higher engagement, better retention, and professional polish that impresses stakeholders.
Standout Features for Creative Flexibility
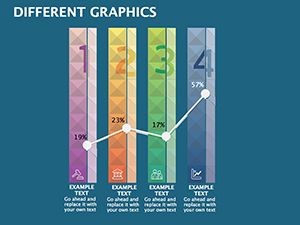
This template's strength lies in its variety: 14 slides packed with editable diagrams, from bar graphs to mind maps, all vector-scaled for clarity. Key features include drag-and-drop repositioning, color customization via Keynote's palette, and layered structures for complex builds. Unlike rigid stock graphics, these adapt fluidly, supporting themes like data analysis or strategy mapping. Benefits? Transform raw numbers into narratives, as in a marketing report where a customized pie chart reveals market shares vividly. Drawing from design principles akin to those in Edward Tufte's works, these ensure minimalism and impact, avoiding clutter for focused messages.
Comprehensive Slide Overviews
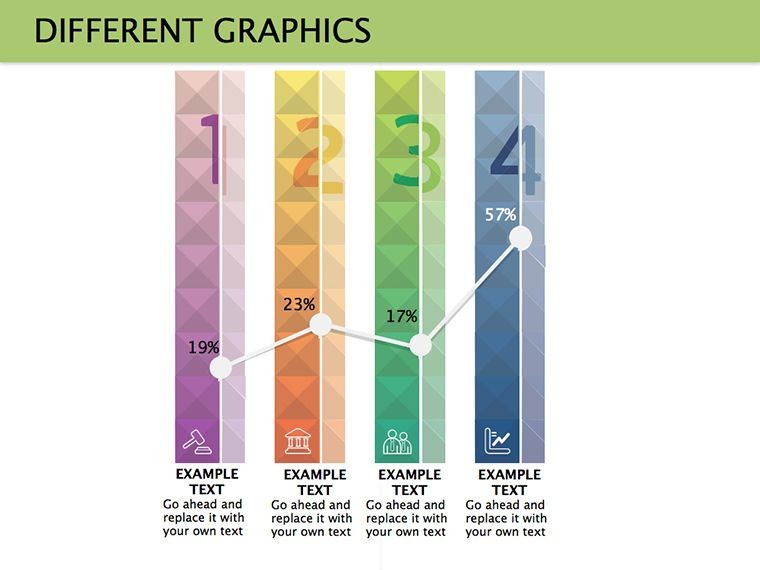
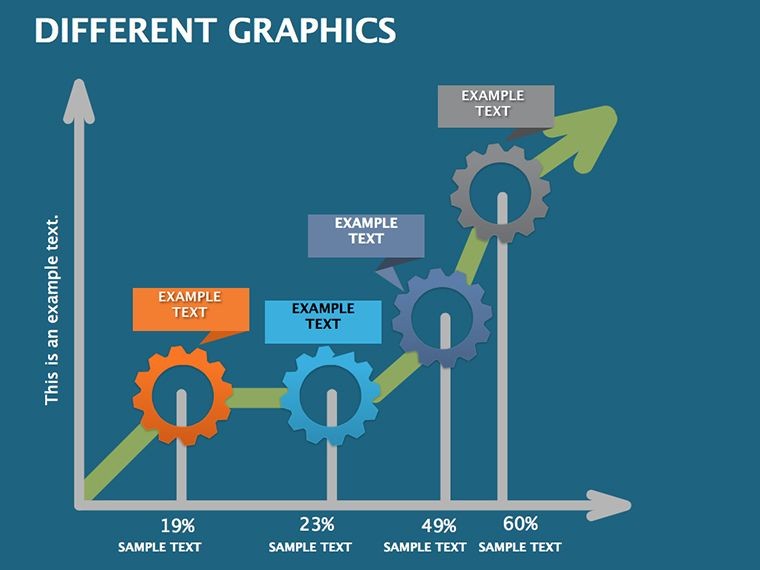
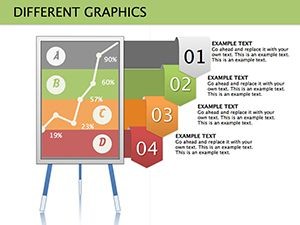
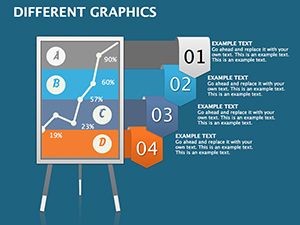
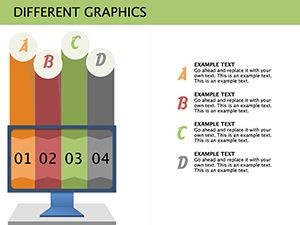
- Slide 1: Bar Graph Basics - Vertical bars for comparisons, with axis labels editable for any dataset.
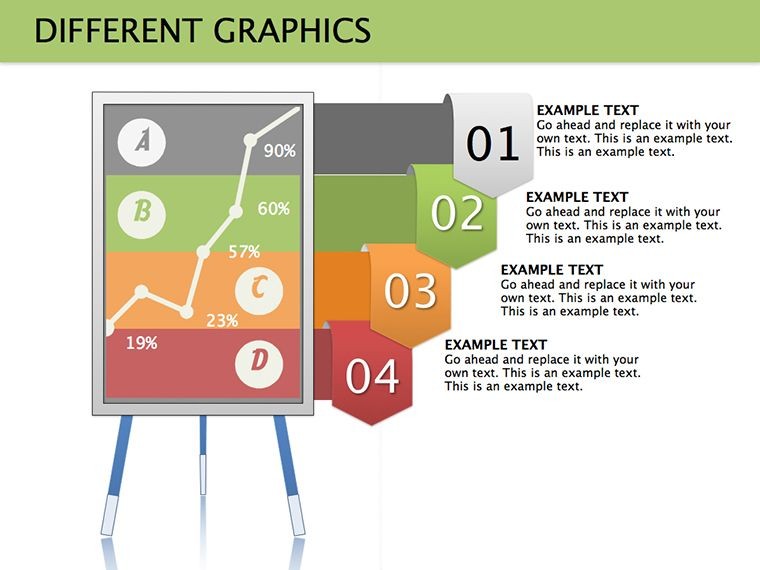
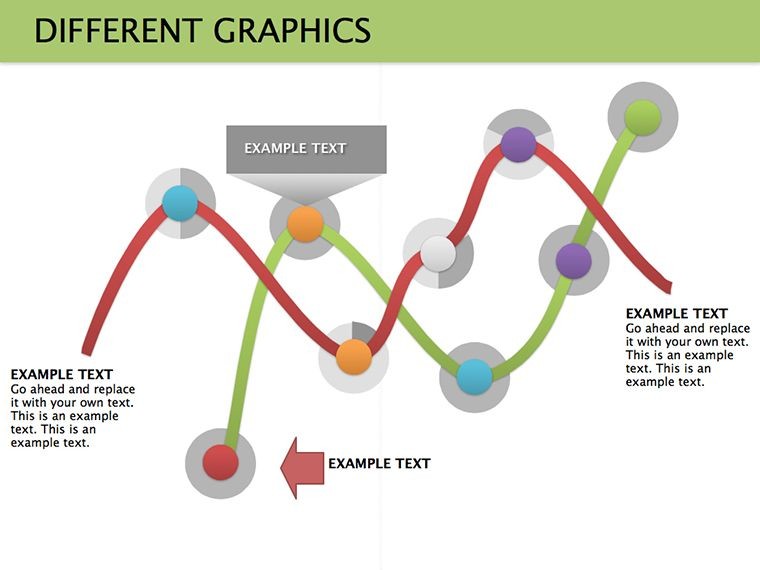
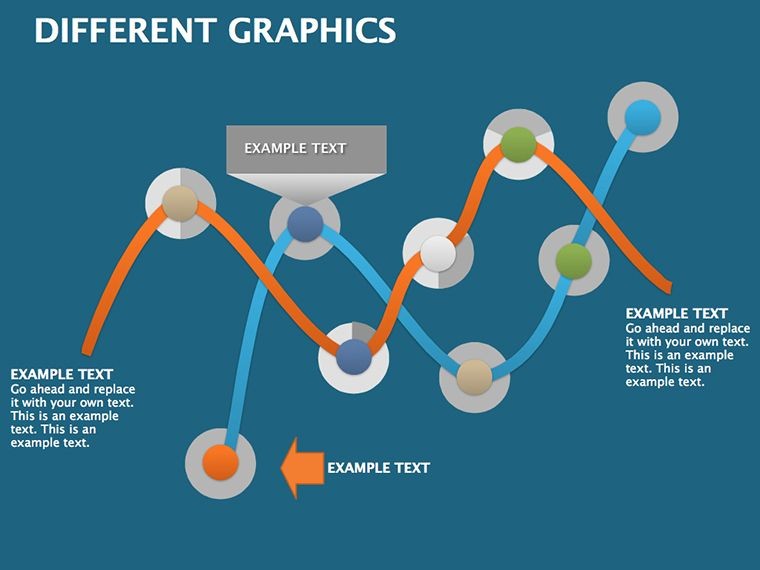
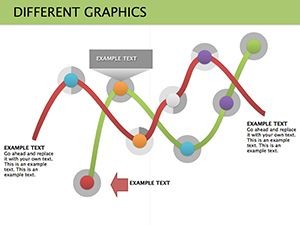
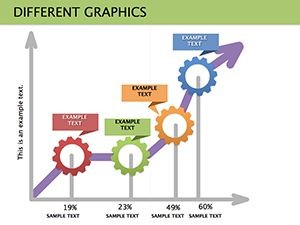
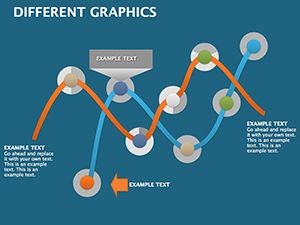
- Slide 2: Line Trend Tracker - Smooth lines for time-series data, ideal for growth projections.
- Slide 3: Pie Distribution - Segmented circles, color-customizable for segment emphasis.
- Slide 4: Area Fill Chart - Stacked areas showing cumulative effects over periods.
- Slide 5: Scatter Plot Analyzer - Points for correlations, with trendline options.
- Slide 6: Bubble Size Mapper - Bubbles varying by value, great for multi-variable data.
- Slide 7: Radar Comparison - Spider webs for multi-attribute evaluations.
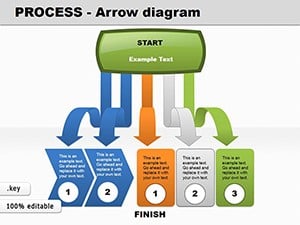
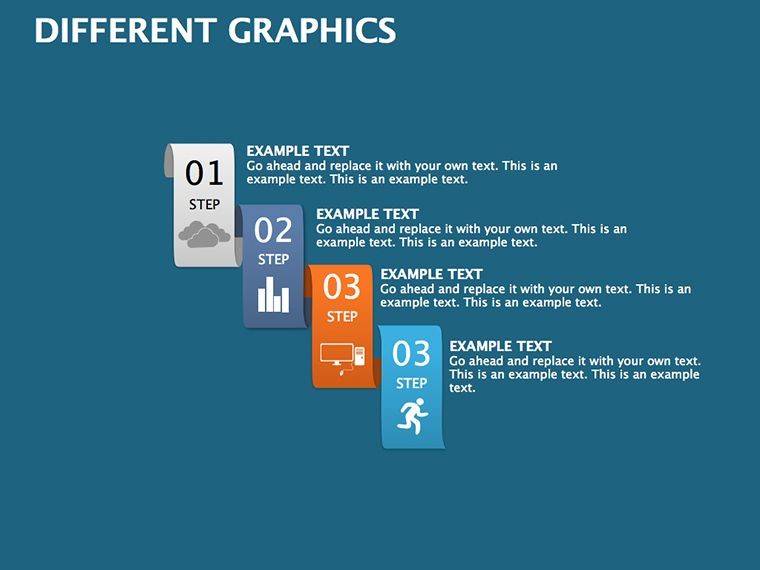
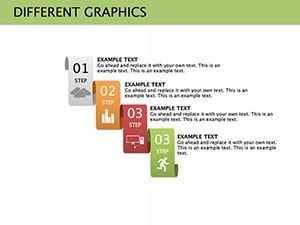
- Slide 8: Funnel Conversion - Narrowing shapes for process flows like sales funnels.
- Slide 9: Heat Map Grid - Color gradients for density visualizations.
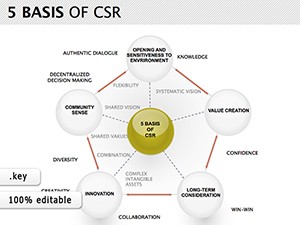
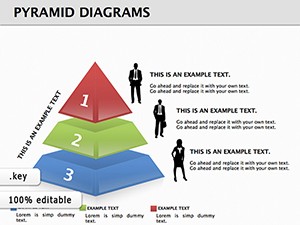
- Slide 10: Tree Hierarchy - Branching for organizational structures.
- Slide 11: Venn Overlaps - Circles for set intersections.
- Slide 12: Gantt Timeline - Bars for project scheduling.
- Slide 13: SWOT Matrix - Quadrants for strategic analysis.
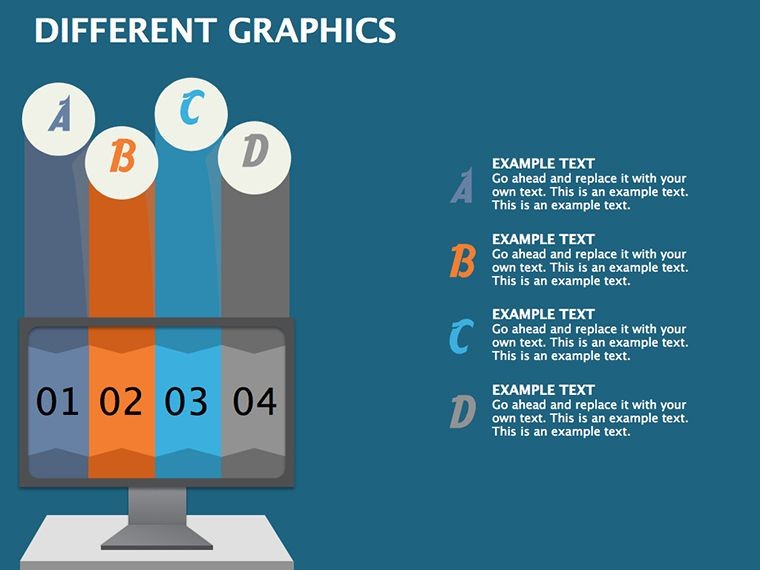
- Slide 14: Custom Combo - Mix-and-match base for unique creations.
For instance, use Slide 5 in a research presentation to plot variables, adjusting positions for emphasis.
Broad Use Cases Across Fields
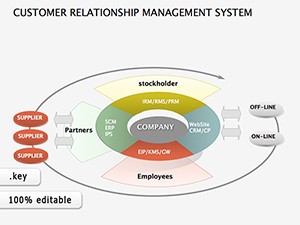
Apply these graphics universally: In business, a finance team might use line trends to forecast revenues, citing a PwC study where visual aids boosted decision accuracy by 40%. Educators can adapt Venn diagrams for literature comparisons, making lessons interactive. For creatives, heat maps visualize user engagement on designs. Versus basic Keynote inserts, this template provides pre-optimized layouts, saving setup time. Tips: Leverage Keynote's magic move for smooth transitions between data states, enhancing dynamism. Workflow: Select diagram, input data, refine visuals, and integrate into your deck effortlessly.
Practical Application Guide
- Launch Keynote and import the template file.
- Choose a slide, e.g., Pie Distribution, and populate with your figures.
- Modify colors and positions to suit your theme.
- Test animations and export for sharing.
- Iterate based on audience feedback for refined versions.
This method tackles data overload, turning complexity into clarity with ease.
Unique Advantages and Reliability
Stand out with this compilation's breadth, aligned with data viz standards from sources like Tableau. Value: Affordable expertise, no design skills needed, plus links to graph categories for expansion. Trust: Fully editable, no hidden fees. CTA: Ignite your ideas - secure this now. It's your gateway to presentation mastery.
With these diagrams, every slide becomes a canvas for innovation, captivating your audience effortlessly.
Frequently Asked Questions
- How flexible are color changes?
- Extremely - use Keynote's color picker for instant, unlimited adjustments.
- Compatible with iOS Keynote?
- Yes, syncs perfectly for mobile editing.
- Suitable for beginners?
- Absolutely, intuitive edits with no steep learning curve.
- Can I combine diagrams?
- Yes, copy-paste elements across slides.
- Data import options?
- Manual entry or link from spreadsheets.