Streamline Your Business Presentations with Keynote Diagrams on Process, Production, and Delivery


Type: Keynote Diagrams template
Category: Process, Business Models
Sources Available: .key
Product ID: KD00140
Template incl.: 14 editable slides
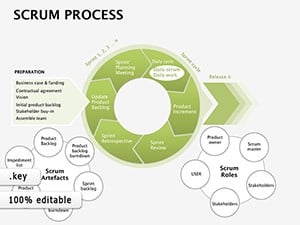
In today's fast-paced business environment, conveying complex operational concepts clearly can make or break your pitch. Imagine transforming convoluted processes into engaging, easy-to-grasp visuals that captivate your audience. Our Keynote Diagrams template, focused on streamlining process, production, and delivery, does just that. Designed for business leaders, managers, and consultants, this template offers 14 fully editable slides compatible with Apple Keynote. Whether you're optimizing supply chains or presenting strategic improvements, these diagrams help you illustrate interconnections seamlessly, saving time and enhancing comprehension.
Drawing from real-world applications, consider how companies like those adhering to Lean Six Sigma principles use similar visuals to identify bottlenecks. This template empowers you to do the same, with diagrams that highlight procedural steps, transformation phases, and customer delivery endpoints. By integrating these elements, you not only demonstrate expertise but also inspire action among stakeholders. Forget generic slides; here, each component is tailored to business models, ensuring your message resonates.
Key Features of the Keynote Process Diagrams
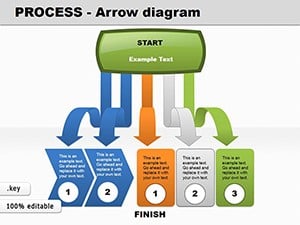
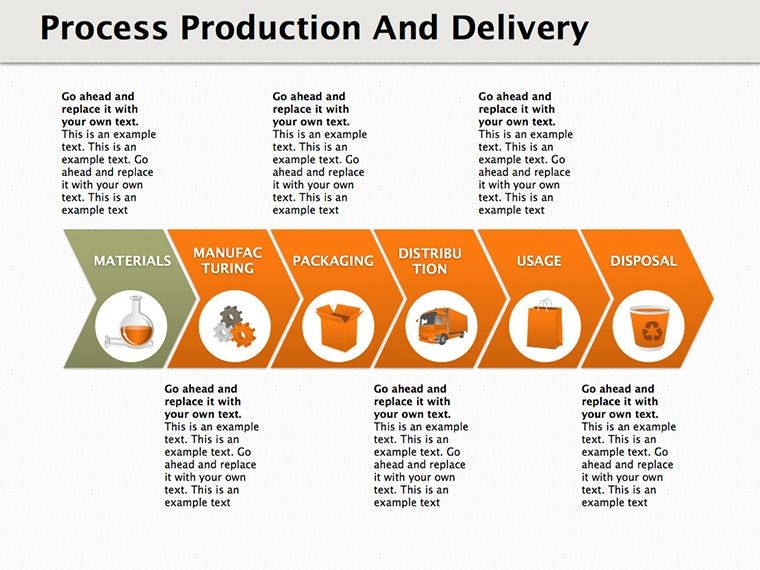
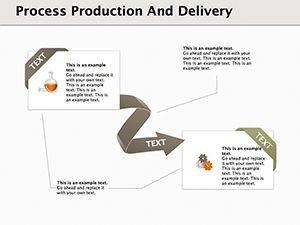
What sets this template apart is its versatility and user-centric design. All 14 slides are built with high-resolution graphics, ensuring they look professional on any screen. Edit colors, shapes, and text effortlessly to align with your brand identity. For instance, the process section includes flowchart-style diagrams that map out sequential steps, perfect for workflow audits.
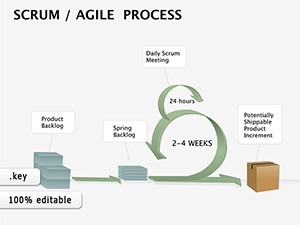
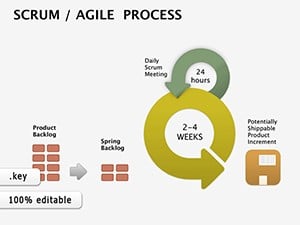
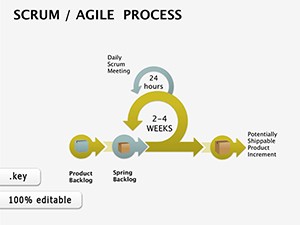
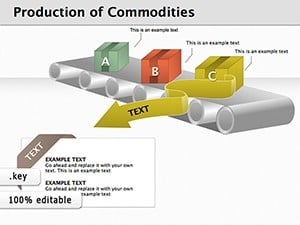
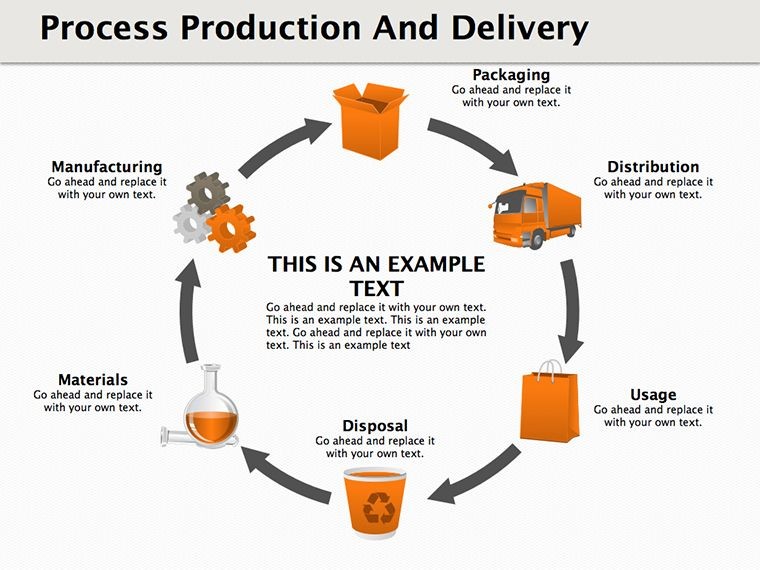
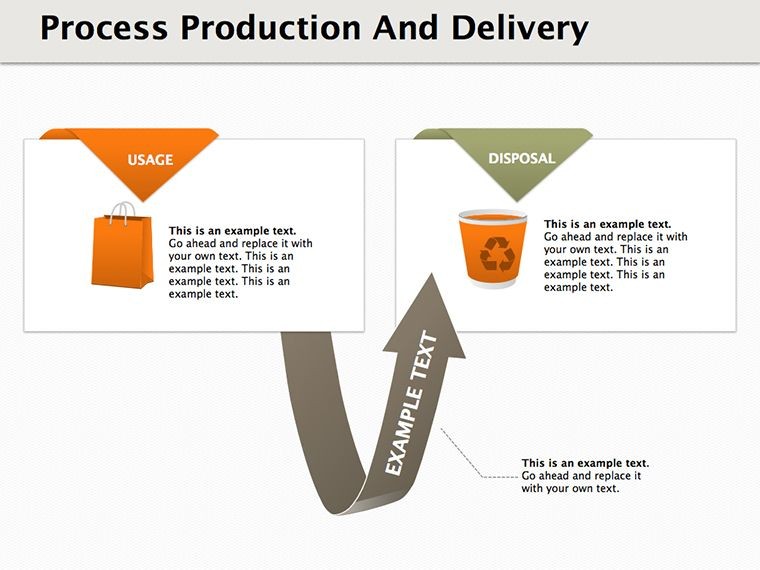
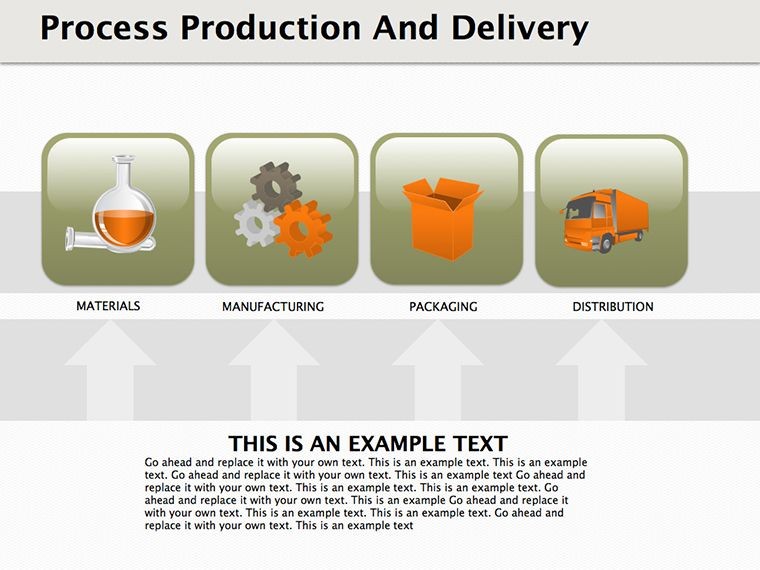
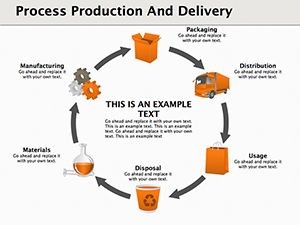
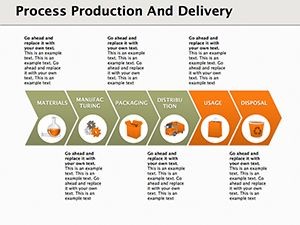
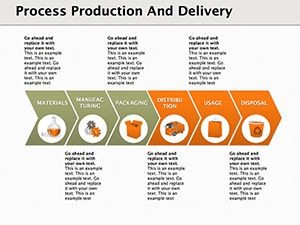
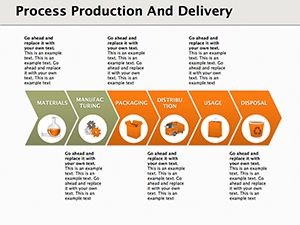
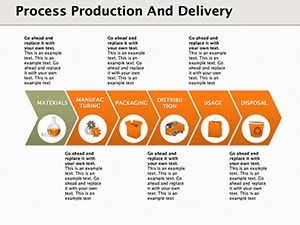
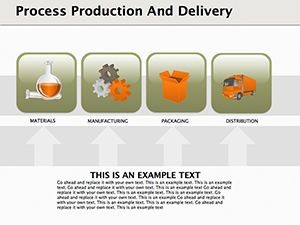
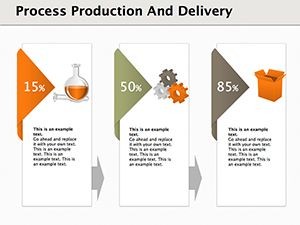
- Interconnected Modules: Visualize how process feeds into production and culminates in delivery, using arrows and nodes for dynamic flow.
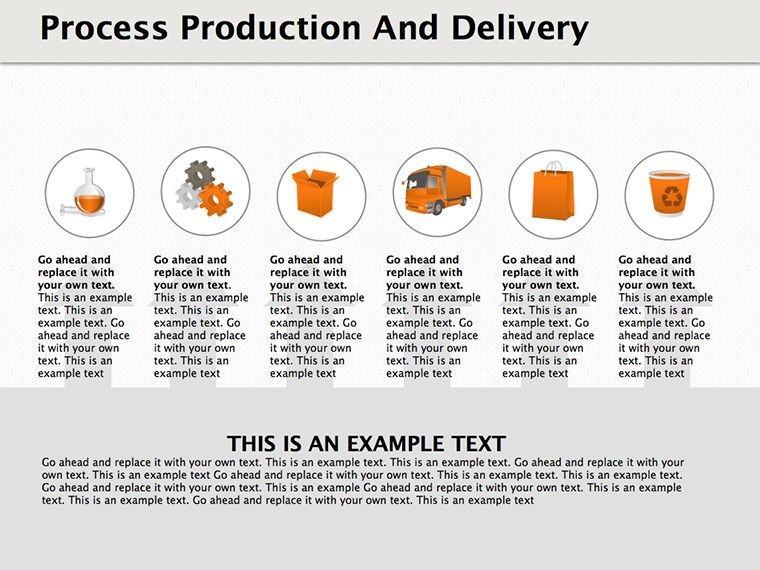
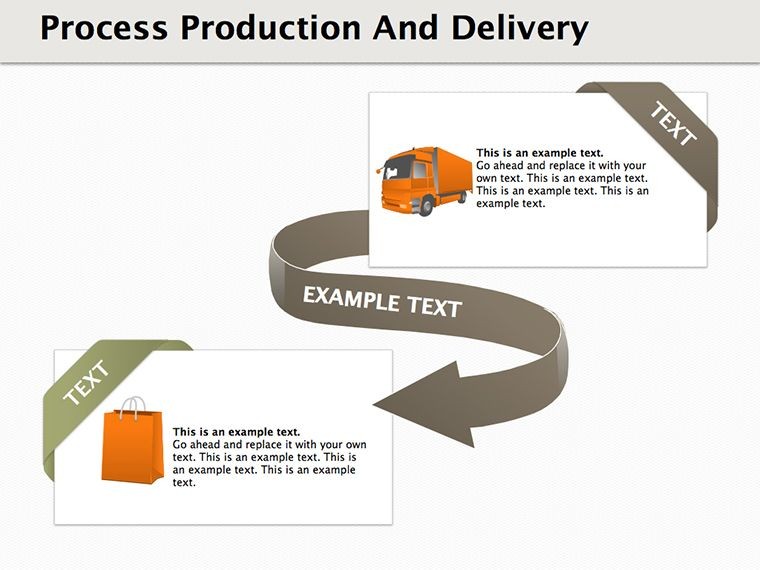
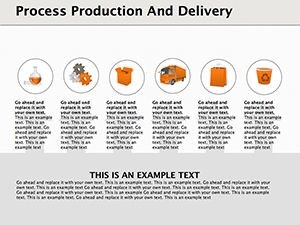
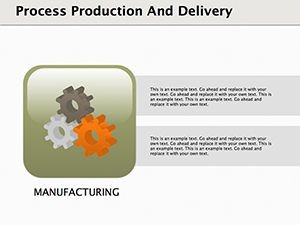
- Customizable Icons: Incorporate themed icons like gears for production or trucks for delivery to add visual flair.
- Data Integration: Embed charts and tables to quantify improvements, such as reducing production time by 20% in case studies.
- Animation Ready: Built-in transitions reveal elements step-by-step, keeping audiences engaged during keynotes.
These features aren't just bells and whistles; they're grounded in presentation best practices from experts like those at TED Conferences, where clarity drives impact. Use them to create narratives that turn data into decisions.
Real-World Applications and Use Cases
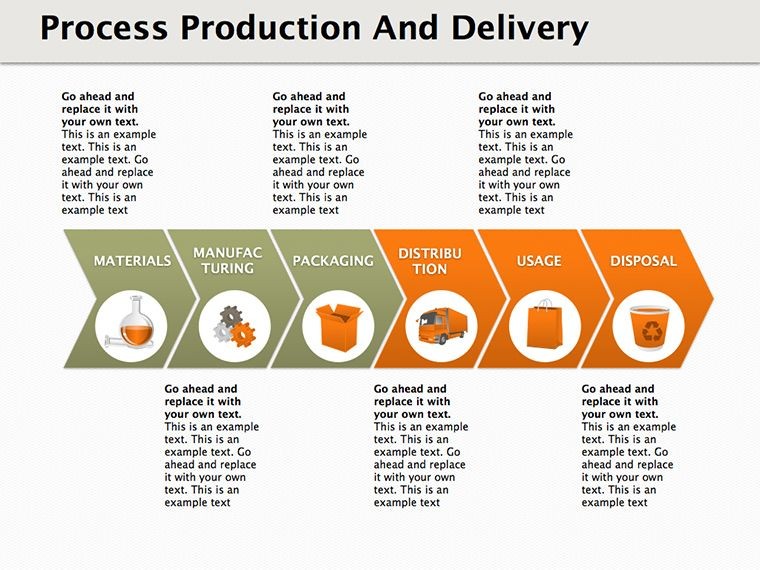
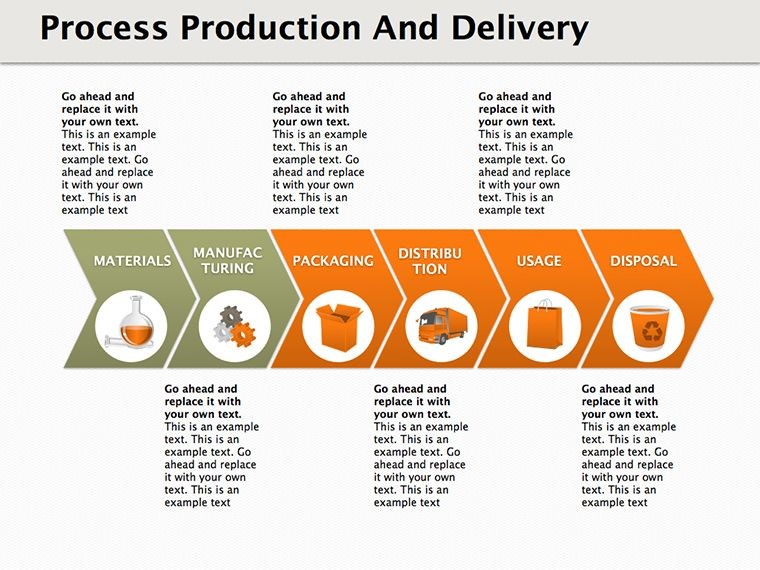
Picture a manufacturing firm pitching to investors: Using slide #3, they map raw material intake through assembly to shipment, highlighting efficiency gains. Or a service-based consultancy employing slide #7 to outline client onboarding processes, production of deliverables, and final handover. This template shines in scenarios like quarterly reviews, where showing operational synergies can secure buy-in.
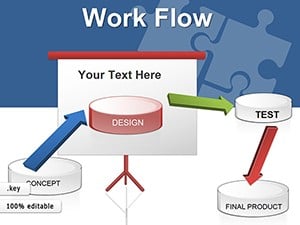
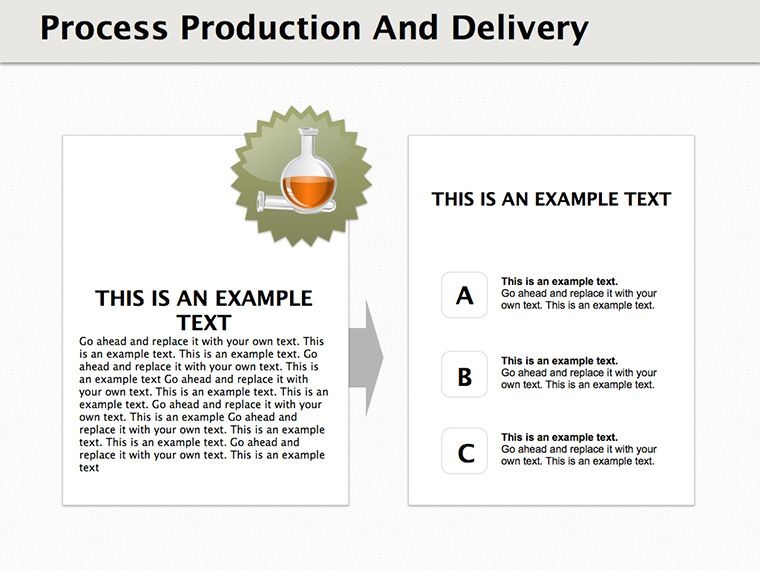
Step-by-step, here's how to apply it: First, identify your core operations - say, software development cycles. Customize slide #1 with your phases: ideation (process), coding (production), deployment (delivery). Add metrics via embedded graphs, then rehearse with animations. In educational settings, trainers use it to teach business fundamentals, drawing parallels to models like Porter's Value Chain.
Compared to basic Keynote tools, this template offers pre-built complexity, reducing design time from hours to minutes. It's like having a design consultant at your fingertips, ensuring your slides meet professional standards without the cost.
Enhancing Efficiency in Daily Workflows
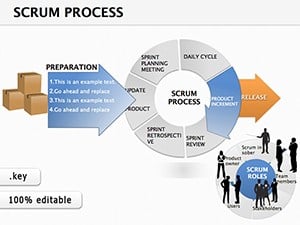
Beyond presentations, integrate these diagrams into reports or dashboards. For example, in agile teams, adapt slide #10 for sprint retrospectives, linking past processes to future deliveries. This fosters a culture of continuous improvement, as seen in companies like Toyota with their Kaizen approach.
Expert Tips for Maximizing Your Diagrams
To elevate your use, focus on audience needs: Simplify jargon in process descriptions, use contrasting colors for production highlights, and include calls-to-action in delivery slides. Test for accessibility, ensuring text is readable and diagrams color-blind friendly. Pair with storytelling - narrate a 'before and after' scenario to showcase transformations.
Incorporate LSI elements naturally: Think editable flowcharts, business optimization visuals, or operational synergy graphics. These enhance search visibility while providing value. Remember, trustworthiness comes from accuracy; back claims with data from reliable sources like Harvard Business Review articles on process management.
Ready to transform your business narratives? Customize this template today and watch your presentations soar.
Frequently Asked Questions
How editable are these Keynote diagrams?
Fully editable - adjust text, colors, shapes, and layouts directly in Keynote without any restrictions.
Is this template compatible with older Keynote versions?
Yes, it works seamlessly with Keynote 6 and later, ensuring broad accessibility.
Can I use these for non-business purposes?
Absolutely; adapt for educational or personal projects, like mapping event planning stages.
What file format is provided?
.key files, optimized for Apple Keynote.
Are there animation options included?
Yes, pre-set animations for smooth transitions between process, production, and delivery elements.
How do I integrate data into the slides?
Easily embed charts or tables; the template supports direct data input for real-time updates.